Data courtesy of Dr. E. Vicenzi, Smithsonian Institute
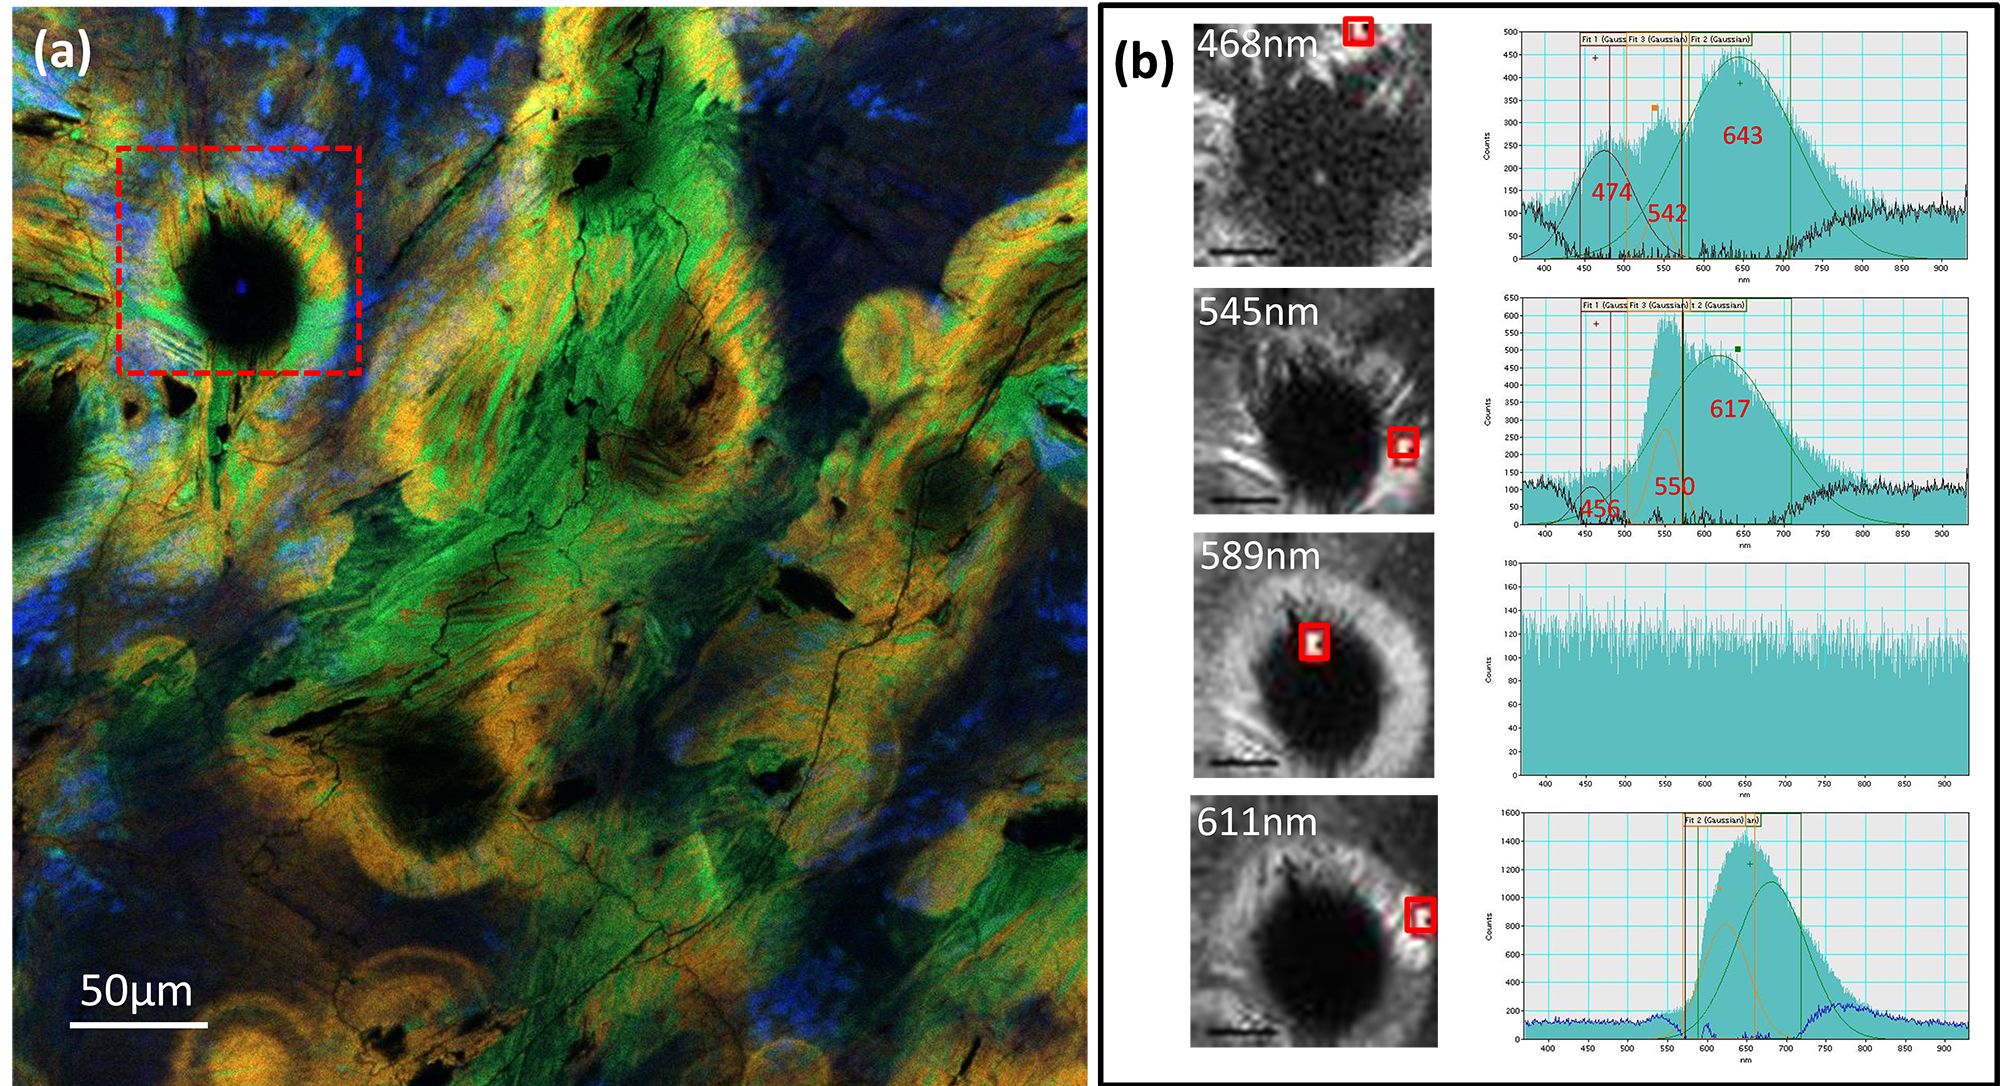
Cathodoluminescence spectrum imaging of polycrystalline diamond
(a) Composite cathodoluminescence image of polycrystalline diamond created using red, green, and blue spectrally filtered cathodoluminescence images. Radioactive fluid ingress along grain boundaries leads to radiation halo effects being observed (yellow). Red square indicates region of specimen where the spectrum-image in (b) was acquired; (b) Four bandpass images extracted from the spectrum-image data cube at wavelengths indicated; red rectangles indicate region of the spectrum-image where cathodoluminescence spectra on right hand side of figure have been extracted. Band assignments: 475 nm dislocation (blue band); 550 nm possible N + V; 630 nm radiation-caused NV-. Spectrum-image acquisition time ~50 ms/pixel.

