GPU Reconstruction Palette
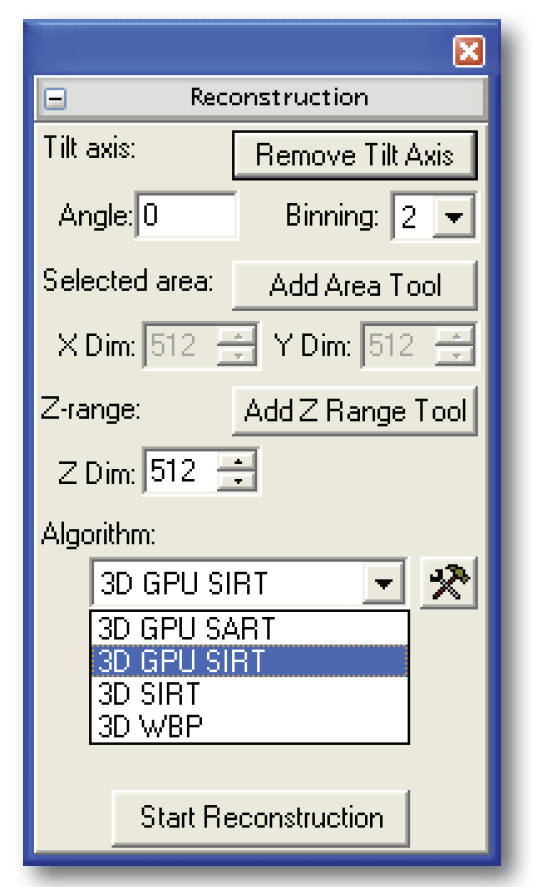
GPU Reconstruction software palette
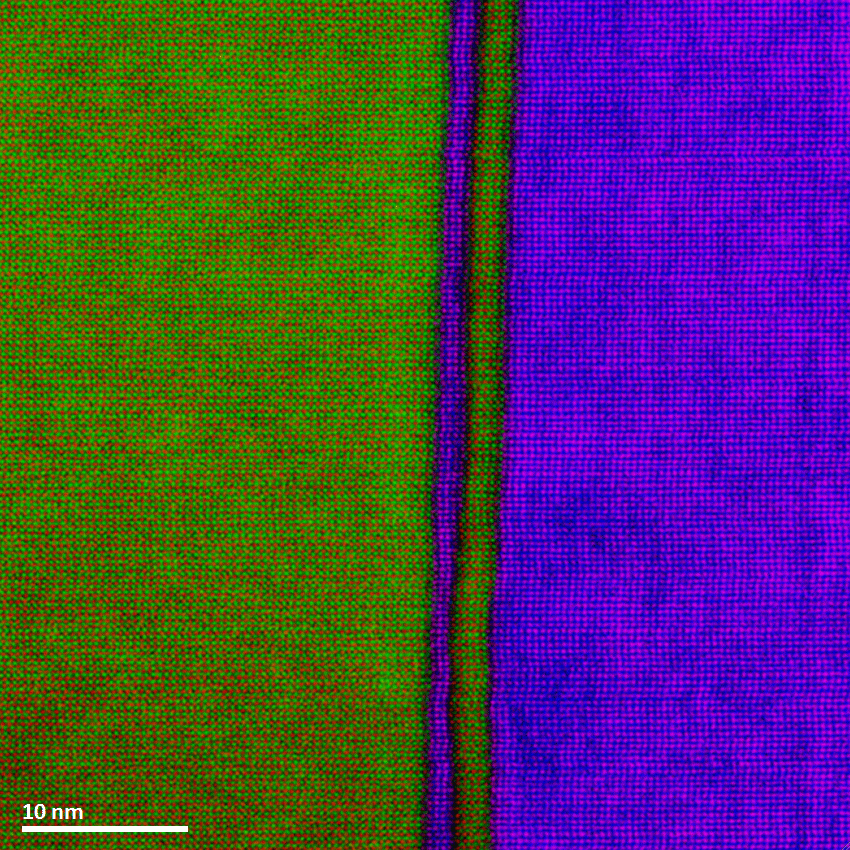
Colorized EELS elemental map
This work was performed in collaboration with Dr. Phil Rice and Dr. Teya Topuria of IBM Almaden Research Center in San Jose, CA who provided expert assistance as well as the TEM specimen and access to their microscope facilities.
Colorized EELS elemental map of Ti L2,3-edges at 456 eV (green), Mn L2,3-edges at 640 eV (blue), La M4,5-edges at 832 eV (purple) and Sr L2,3-edges at 1940 eV (red).
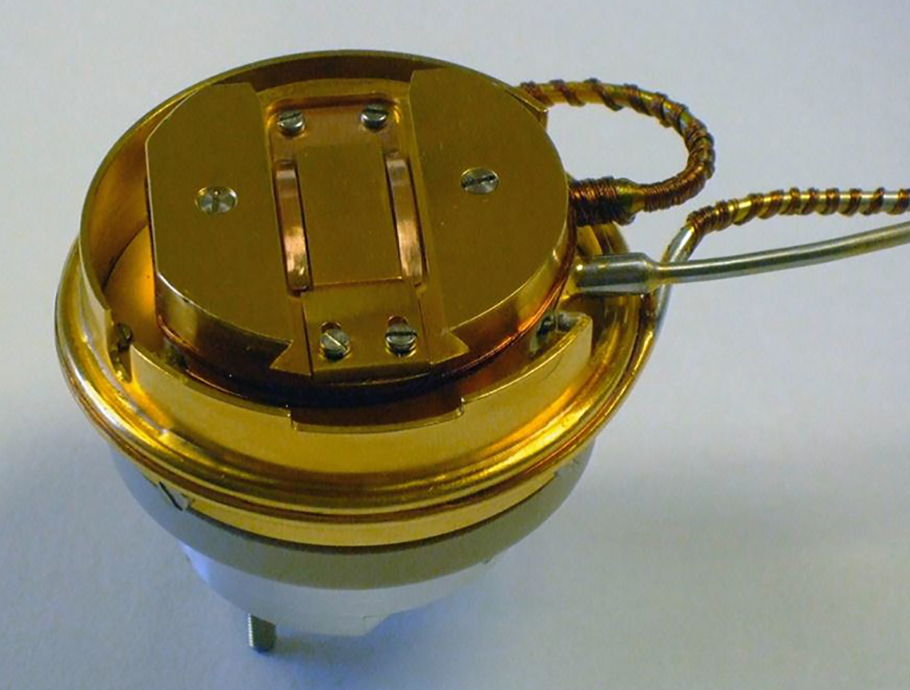
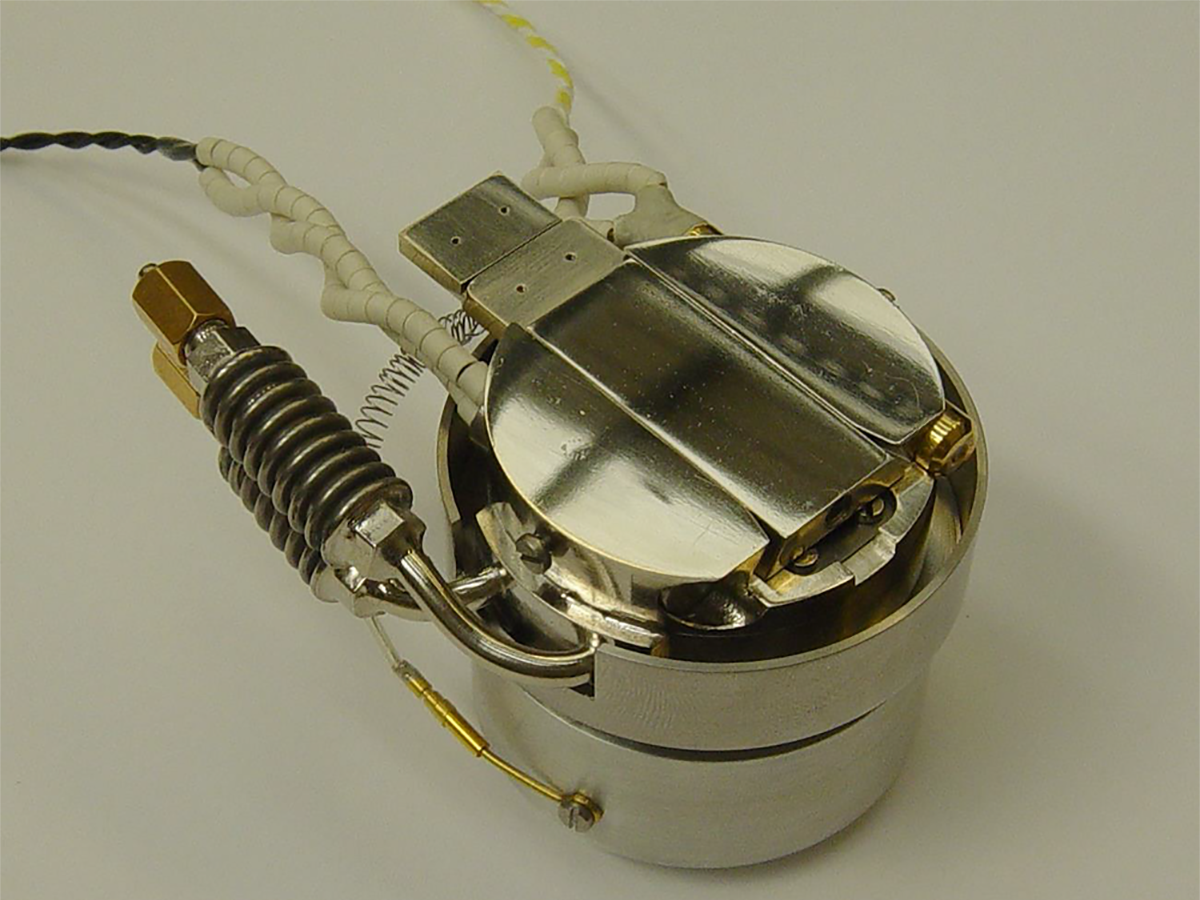
Murano heating stage
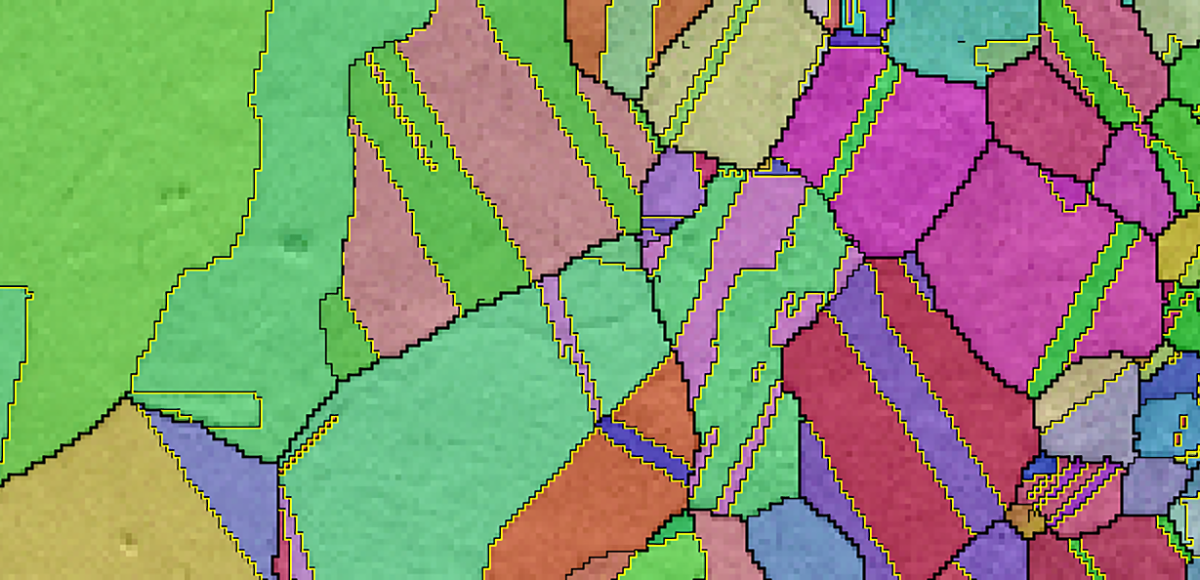
EBSD map of bronze specimen recrystallization taken in-situ at 800 °C using Murano™ heating stage.
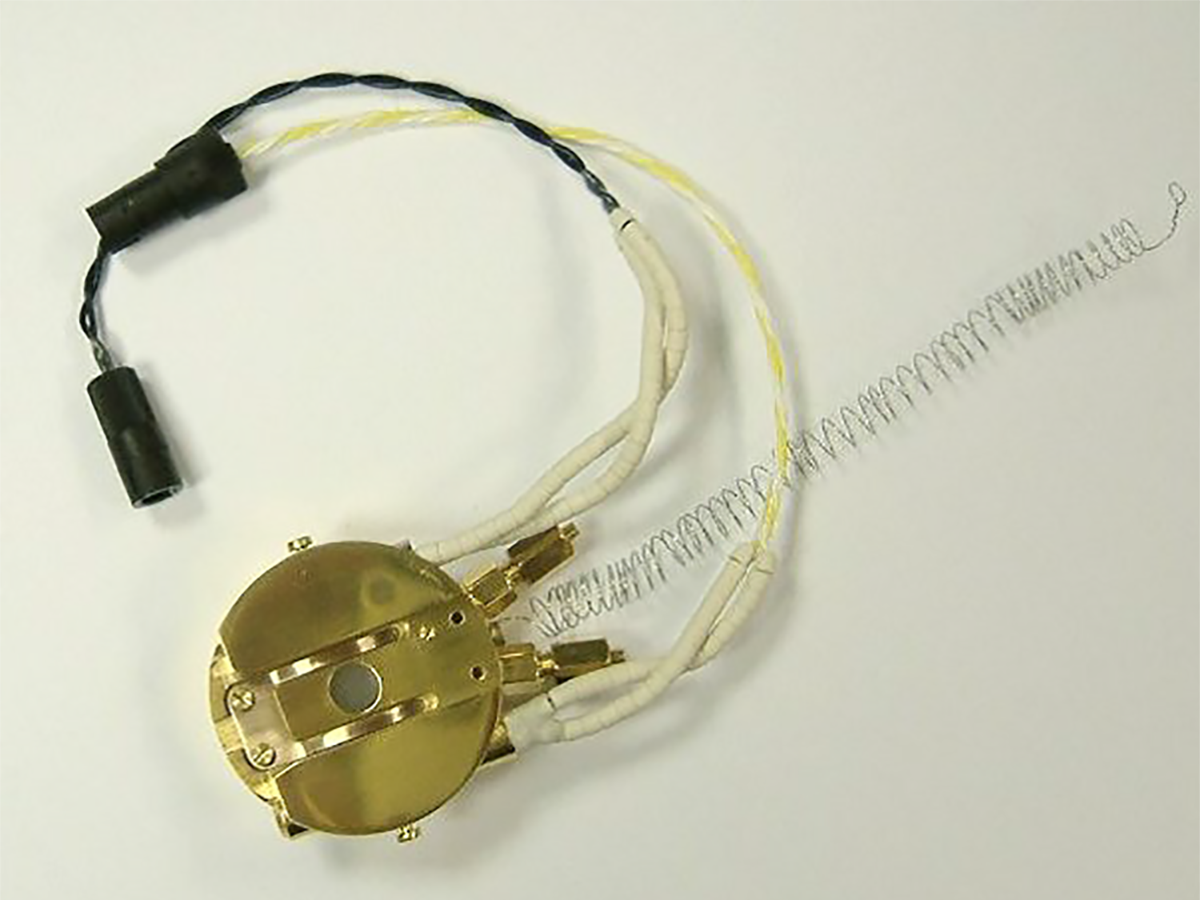
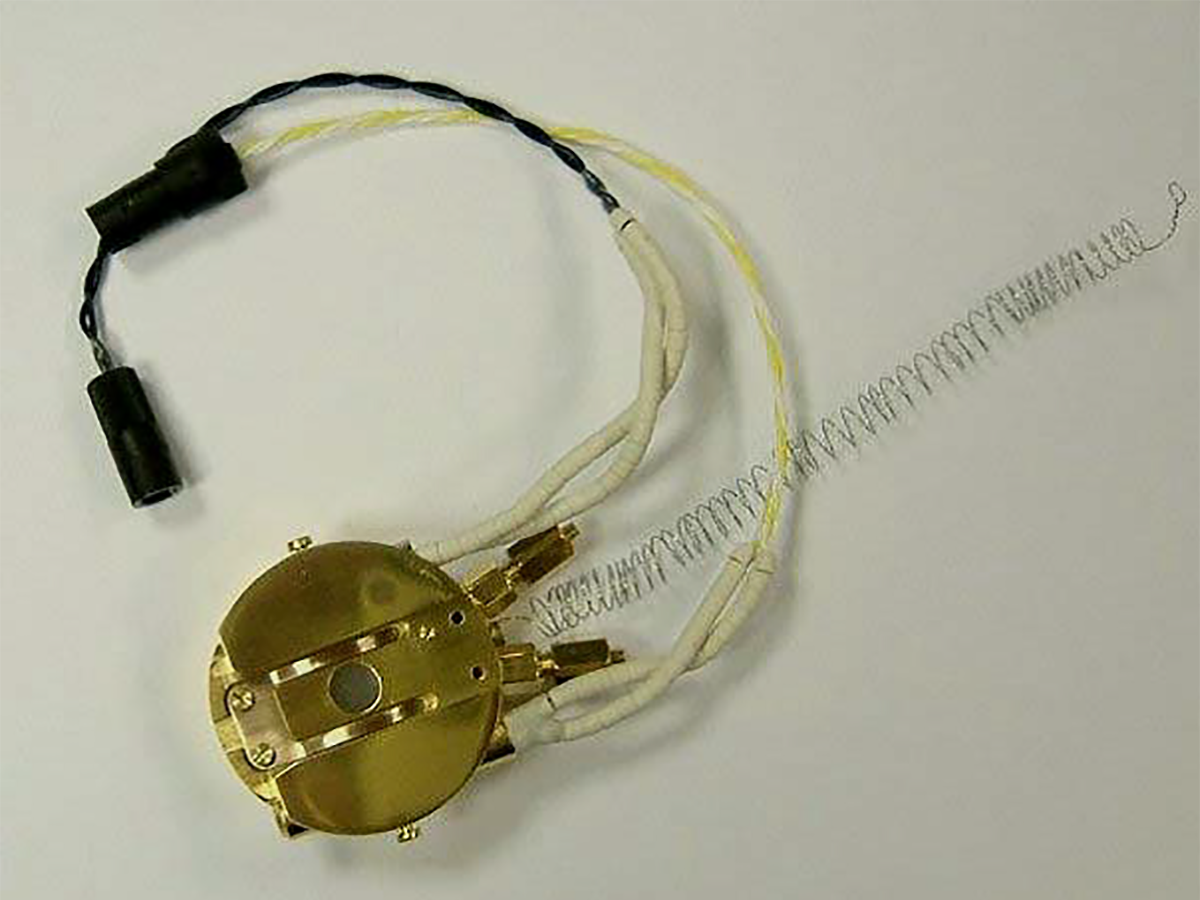
CF302M Liquid helium cooling stage
C1003 Nitrogen cooling stage
C1002 Nitrogen cooling stage
C1001 Nitrogen cooling stage
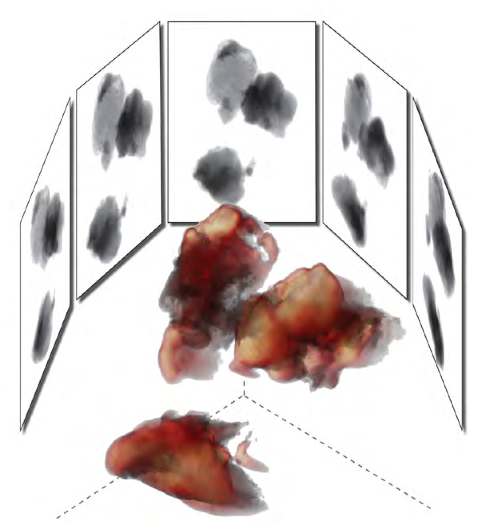
3D Reconstruction of Interplanetary Dust Particle
Data courtesy of Dr. Ilke Arslan of Sandia National Laboratories, Livermore, California and Dr. John P. Bradley of Lawrence Livermore National Laboratory, Livermore, California.
3D reconstruction of interplanetary dust particle. STEM tilt series acquired with a 806 HAADF detector from -61° to 68°. Aligned, reconstructed and visualized using 3D Reconstruction and 3D Visualization software. The iso-surfaces highlight two different intensity levels in the reconstruction.
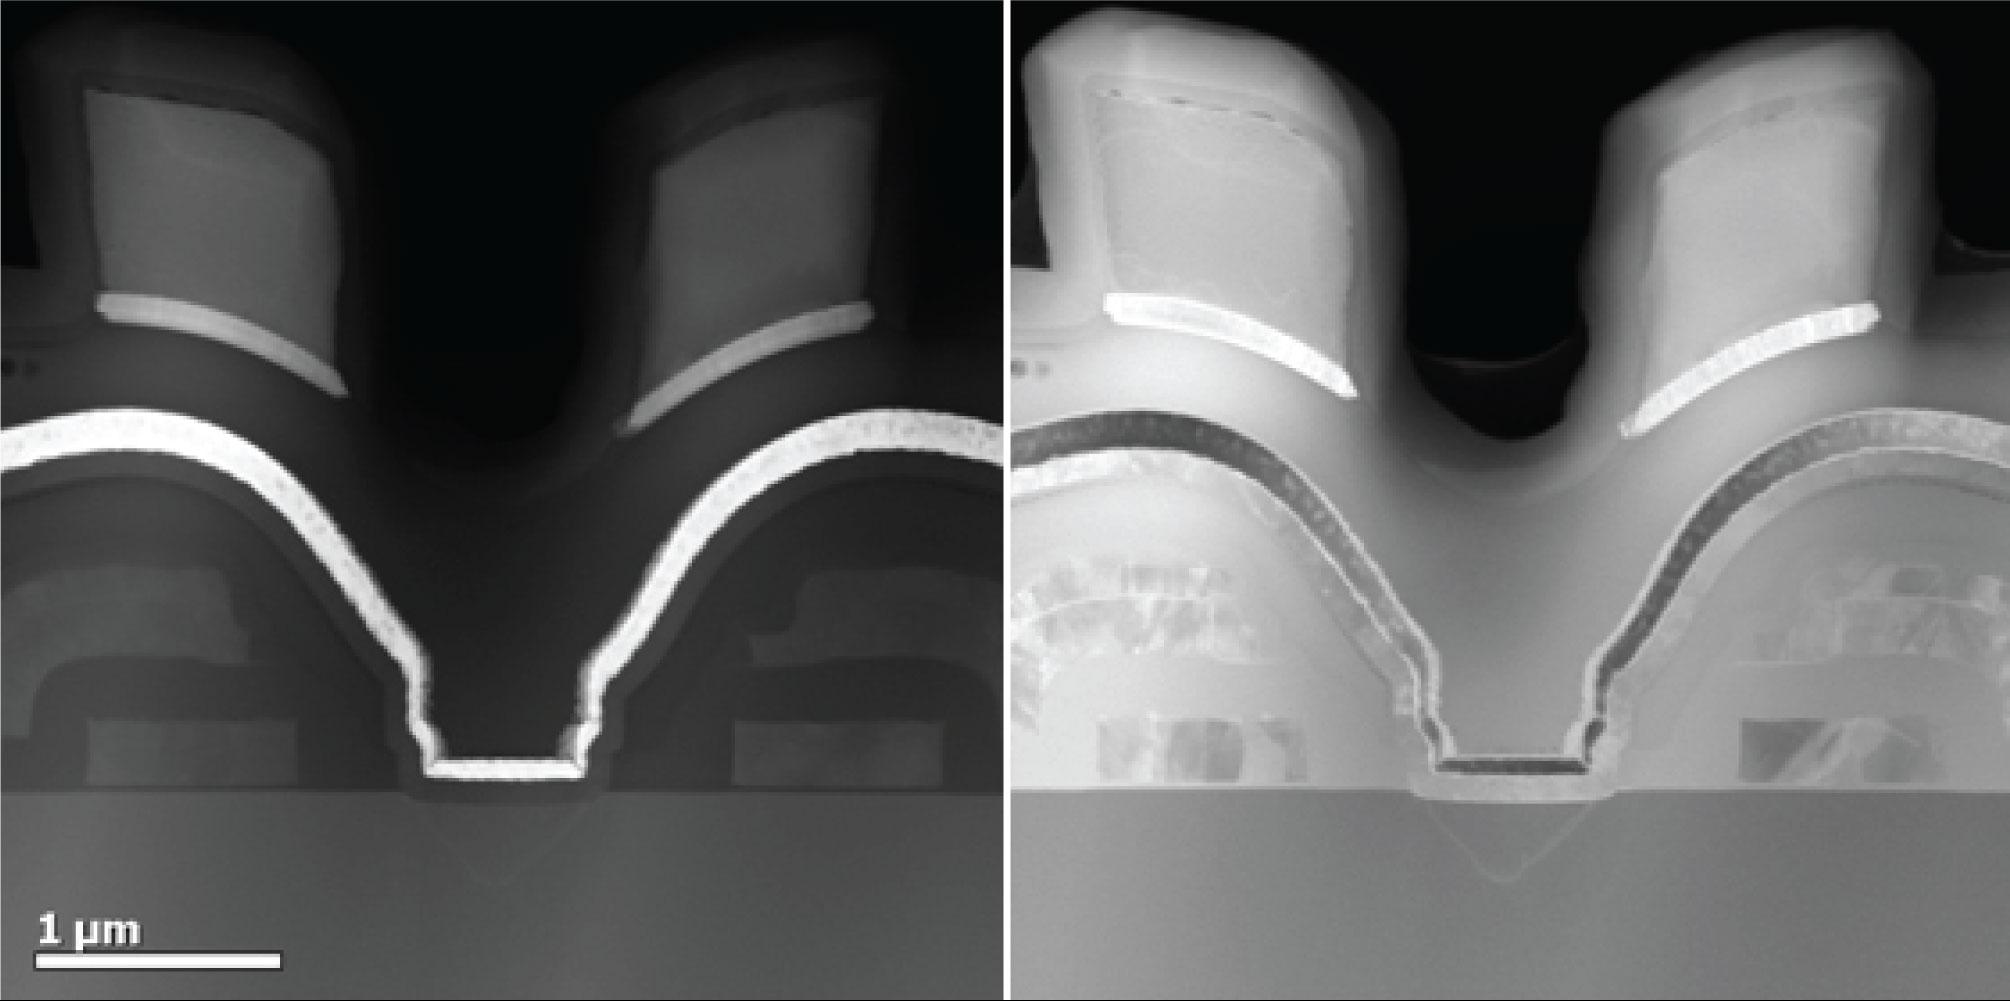
Jointly acquired HAADF and MAADF signals
The HAADF signal (left) contrast is easily interpreted in terms of mass thickness of the material while the diffraction contrast MAADF signal (right) reveals highly detailed structural changes in the material. The optimized geometry makes this possible.
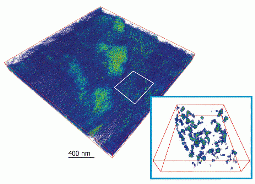
Phosphorus-containing macromolecular assemblies in the cell nuclei of drosophila larvae
Data courtesy of Dr. Maria Aronova and Dr. Richard Leapman, National Institutes of Health, Bethesda, Maryland.
Image of phosphorus-containing macromolecular assemblies in the cell nuclei of drosophila larvae; dual-axis EFTEM tilt series acquired with a Tridiem energy filter from -66˚ to 66˚; for each axis phosphorus L-23 series (20 eV slit, pre-edge and post-edge) were collected; a jump-ratio series was calculated and the data were aligned and reconstructed using IMOD (University of Boulder, Colorado); finally, the reconstruction was rendered in the 3D visualization software; the inset highlights a sub-volume extracted using the 3D visualization ROI tool.
Pages
