Revealing the distribution of organic materials in the SEM
Data courtesy of G Nichols, Pfizer UK
Distribution of drug within a pharmaceutical pill. Composite color image showing the spatial distribution of the micronized drug, salmeterol xinafoate. The cathodoluminescence image acquired at 415 m showing the drug is displayed in green and the secondary electron image reveals the non-cathodoluminescent lactose monohydrate (shown in brown).
Plasmonics
Data courtesy of Dr. M. Bosman, A*STAR IMRE, Singapore
Cathodoluminescence investigation of gold prisms in the STEM: (a) and (b) are bright field TEM images and (c) and (d) are the cathodoluminescence intensity maps recorded in STEM mode from particles (a) and (b) respectively. The change in size of the prism leads to a change in the local surface plasmon resonance modes causing a change to the spatial and spectral (not shown here) distribution of luminescence.
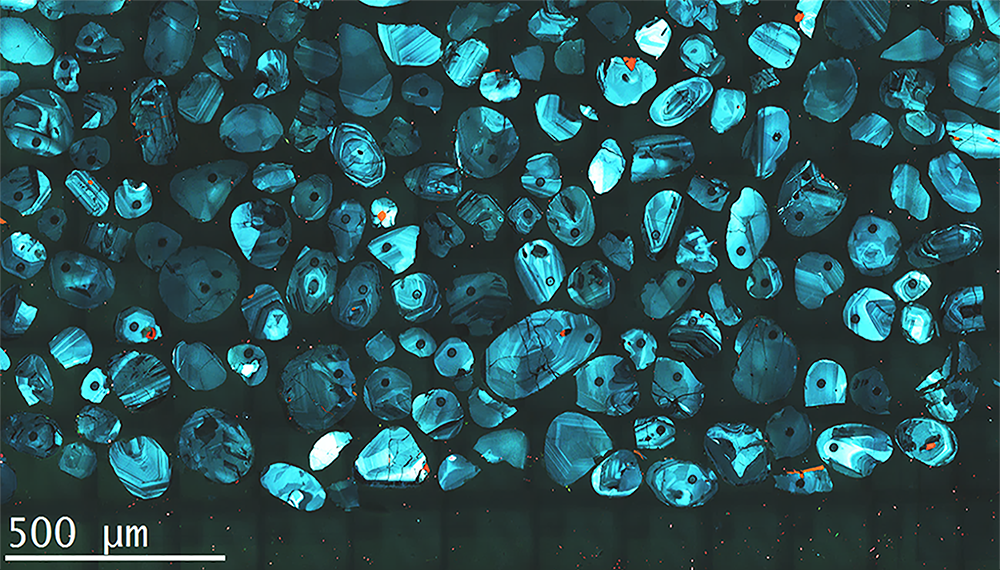
Collection of polished zircon grains
Color cathodoluminescence images of collection of polished zircon grains in epoxy mount; images acquired simultaneously using ChromaCL2 iBSED and field stitching software module. Many grains are highly zoned, and of a type that has been interpreted to be igneous in origin. Several grains also exhibit metamorphic rims.
Shale of various orogeny
Images (a), (b) and (d) –(f) courtesy of Dr. J. Schieber, Indiana University.
Color cathodoluminescence reveals provenance of populations of quartz grains (a) Cleveland shale (Devonian); low grade metamorphic acadian orogeny; (b) Barnett shale (Miss.) Texas; low grade metamorphic ouchita orogeny; (c) Unspecified; (d) Santa Barbara basin shale (modern); plutonic (Sierra Nevada) and metamorphic (recycled coast range sediments); (e) Mancos shale, Utah; low and medium grade metamotphic quartz, sevier orogeny; (f) Huroh shale (Devonian); medium grade metamorphic and plutonic. All samples prepared using Ilion+ II broad beam argon milling system.
Sandstone (quartz arenite)
Image courtesy of Dr. J. Schieber, Indiana University.
Quartz grains from granite and metamorphic source with low temperature quartz cement (bluish). There is a later (hotter) overprint (reddish) along grain boundaries in the overgrowth.
Mili-electron volt energy resolution
Data courtesy of Dr. G. Fern, ETC, University of Brunel
Cathodoluminescence spectrum of Europium-doped yttrium oxide particle measured with Vulcan system. Europium ion d-to-f interband transitions produce narrow emission lines; excellent energy resolution of Vulcan™ system resolves two spectral peaks with peak-to-peak separation of only 1.6 meV.
Methods
Acquired using JEOL 2100F
STEM mode
200 kV
Room temperature.
Analyzing the active region of a commercial InGaN LED grown on silicon substrate: Correlating luminescence with microstructure
Sample courtesy of J. Griffiths, University of Cambridge
(a) Dark field STEM image revealing six 3 nm thick InGaN wells; (b) Cathodoluminescence (CL) image of same region (acquired simultaneously) showing up to 20x variation in the luminescence efficiency locally; (c) Overlay of DF and CL STEM images with the position of threading dislocations shown by yellow dotted lines. Some dislocations quench the quantum well luminescence (red arrows) while others have no effect, or actually enhance emission (green arrows).
Cathodoluminescence and EELS analysis of plasmonic nanoparticles
Cathodoluminescence (CL) and EELS analysis of gold prism of 250 nm side length. (a) STEM dark field image, (b) Cathodoluminescence total light intensity map with prism outlined by black dotted line and (c) Comparison of CL and electron energy loss (EELS) spectra in TEM/STEM system with FEG electron source. The tail of the EELS zero loss peak (FWHM 0.65 eV) is convoluted with the surface plasmon resonance mode obscuring information. CL is an emission spectroscopy and, therefore, independent of energy spread of primary electron beam.
Cathodoluminescence analysis of plasmonic nanoparticles
Cathodoluminescence analysis of a gold prism of side length 200 nm. (a) STEM dark field image, (b) – (d) monochromatic (spectrally resolved) cathodoluminescence images at 1.37, 1.90, and 1.95 eV (900, 650, and 420 nm, respectively) with prism outlined by yellow dotted line, (e) Overall cathodoluminescence spectrum displaying three peaks.
Methods
JEOL 2100F
STEM mode operating
100 kV
room temperature.
(a) – (d) 768 x 768 pixel images acquired in 70 s
Cathodoluminescence analysis on GaN/AlN nanowires
Data courtesy of Dr. R. Williams, Ohio State University.
a) Dark field STEM image of GaN/AlN heterostructure nanowire with nominally 3 nm thick GaN quantum wells and 4 nm thick AlN barrier layers; GaN is bright in DF image; (b) Cathodoluminescence (CL) spectrum-image acquired from region indicated by green rectangle in (a) with intensity at 491 ±10 nm displayed; (c) Single CL spectrum extracted from the spectrum-image at point 2 as displayed in (b); (d) Projection of the CL spectrum with information along y-axis (radial axis of the nanowire) summed into a single value.
Pages


")


