Cathodoluminescence techniques for the geosciences
Cathodoluminescence (CL) microscopy—the analysis of light emitted by a mineral or gemstone when excited by an electron source—is a very effective microanalysis tool used to understand our geological history. In particular, this technique finds extensive use in determining mineral provenance for geochronology and metamorphic alteration studies and, more recently, thermobaromtery for petrographic applications.
Spatial Information Spectral Information Both Spatial & Spectral Information
The phenomenon of cathodoluminescence was first reported in 1879 by Crooks, who examined the blue-green light emitted from synthetic calcium sulfide crystals bombarded with a cathode ray1. In the original publication, Crooks reported that “many natural minerals and gems shine with great splendor when struck by a high energy electron beam” and notes that “Diamonds from other localities shine with different colors, such as bright blue, pale blue, apricot, red, yellowish-green, orange, and bright green.”

The first report hints at why the CL technique is an important microanalysis tool. Although the light emission mechanism of cathodoluminescence can be a complicated process in minerals and gems (insulator materials characterized by an electronic structure with a wide forbidden energy gap), the observed luminescence is often directly associated with trace element impurities (or sometimes crystal defects). With recent developments in CL detector sensitivity, microanalysis at the parts per million level are now demonstrated.
The photons emitted in the CL process may be described by their wavelength, polarization, and angular distributions (Figure 1). However, for practical geoscience applications, the most important properties are the photon emission rate and wavelength distribution (color). CL initially found widespread application in the 1960s and 1970s, where CL images were collected in an optical microscope with an electron flood gun attachment. The CL images were used to reconstruct the processes of mineral formation and alteration by the visualization of growth textures not observable by other techniques. For example, Figure 2 shows cross-polarization, backscattered electron, and cathodoluminescence images of the same (partially decomposed) zircon and growth textures that are only observable in the CL image.
 reveals a core and rim structure with some inhomogeneity in the central region, the backscattered electron image (b) captured using an SEM reveals a decomposed rim and core and, the cathodoluminescence image (c) reveals internal texture not observable by the other imaging techniques. Images courtesy of Michael Zanetti, Washington University in St. Louis and the McDonnell Center for the Space Sciences, Earth and Planetary Science Dept.")
In the last 50 years, there have been significant developments in electron microscopy and CL detectors that enable the collection of CL maps from entire 1” x 2” thin section samples and, with the move to CL in the SEM, with spatial resolutions approaching the nanoscale. A wide variety of CL detectors for the SEM are available commercially with a diverse range of analytical capabilities. Here we review how the different operating modes of modern CL detectors may be applied to typical geological applications, aiding the selection of CL detector choice.
For more information, visit WhatIsCL.info.
CL detection modes in an SEM and their application in the geosciences
A focused beam of electrons impinges on a sample under investigation, inducing the emission of light in the ultraviolet, visible, and near-infrared wavelength ranges of the electromagnetic spectrum. The emitted light is then collected and analyzed by an optical detection system. The electron beam of the SEM may be placed with nanometer precision and, if desired, scanned across the surface of a sample in a stepwise fashion and the CL emission analyzed at each step.
Spatial information: Unfiltered imaging
Sometimes also referred to as panchromatic, polychromatic, or integrated intensity imaging
The spatial distribution of the photon emission rate is recorded without recourse to dispersion or filtering by wavelength. Data is displayed as black and white images with the intensity grayscale corresponding to the measured photon rate (Figure 3). The CL detector may be as simple as a photon sensitive device, such as a photomultiplier tube (PMT) or silicon diode, located close to a sample. Unfiltered images may be captured in a few seconds or tens of seconds, depending on the sensitivity of the detection equipment used.
 Schematic representation of an unfiltered cathodoluminescence image—the integrated photon flux is plotted pixel-by-pixel across two spatial dimensions. (b) An unfiltered CL image of a collection of polished zircon grains revealing internal texture related to (re-)crystallization. Some zircons exhibit late rims (indicated by arrows) where the grain exteriors date to a later geological period than the core. Images captured using the MiniCL™ detector.")
For a limited number of applications, this simple form of CL mapping provides all necessary information. In geochronological investigations, CL maps are used to visualize late rim formation in zircons during U/Pb radiometric dating. During these studies, zircons are frequently used as a geological clock because of the small amounts of radioactive U isotopes and their decay products incorporated into the crystal structure during crystallization. In zircons that have undergone more than one crystallization event, e.g., zircons with (old) inherited zircon cores in younger igneous zircons, the U/Pb isotope ratio in each crystallization period will differ based on the time elapsed (U is immobile in the zircon crystal). This polyphase structure often cannot be recognized by conventional imaging methods, such as light microscopy, but needs to be resolved for accurate dating results. However, zircons can be selected for dating purposes using CL in the SEM. Specifically, zircon phases of different ages can be identified by the presence of late rims, which in an unfiltered CL image appear as bright regions at the grain perimeter. Moreover, conclusions on the origin and the development of the inherited phases can be drawn by comparison with detrital zircons.
Spectral information: (Single point) CL spectrum
The wavelength distribution of the emitted light is recorded from a point or region of the sample exposed to the SEM’s electron beam. Data is displayed by plotting intensity against wavelength or energy; wavelength and energy are inversely related according to
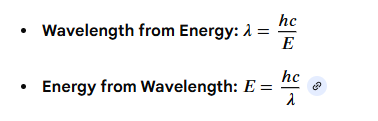
where
h = Planck’s constant
c = Speed of light.
A spectroscopic CL detector typically comprises a light-collecting objective and an optical spectrometer such as a spectrograph or scanning spectrometer (with PMT). Using a spectrograph, a wavelength-resolved spectrum is captured in a single acquisition using a pixelated detector such as a charge-coupled device (CCD). Alternatively, the CL spectrum may be captured by scanning a range of wavelengths and recording the light intensity at each wavelength (referred to as a wavelength-filtered spectrum). A wavelength-resolved spectrum may be captured in a few milliseconds to a few seconds, whereas a wavelength-filtered spectrum typically requires several tens of seconds.
Application
CL spectroscopy can be used for microanalysis by revealing the presence (or absence of) trace element or defect centers responsible for features in a CL image. For example in calcite (CaCO3), luminescence associated with Mn2+, Pb2+, Ce3+, Fe3+, Sm3+, and Dy3+ trace elements have been observed with each trace element giving rise to luminescence at a different wavelength, and in Beryl (BeAl2Si6O18) Cr3+, Fe3+, and Mn2+ luminescence centers have been measured (Figure 4).
 schematic representation and b) CL spectrum captured from a beryl crystal with luminescence peaks associated with Cr3+ (peaks at 681.24 and 683.6 nm with FWHMs 0.88 and 1.53 nm respectively) and Fe3+ (720 nm with FWHM 110 nm).Spectrum captured using the Monarc™ detector.")
The electron beam of the SEM places the sample into an energetic state by generating free carriers (electrons and holes). One mechanism that the sample returns to the ground (energy) state is by the release of photons—CL. Many different factors influence the intensity and wavelength of CL, including (i) the band-gap energy of the mineral; (ii) the presence of structural defects (e.g., vacancies, dislocations); and (iii) the presence and concentration of trace elements. These latter centers may introduce (mid-gap) energy states; alternatively, they may allow intra-ion energy transitions such as within the d orbitals of transition metals or the f orbitals of rare earth elements (REE). The electronic transitions between these mid-gap or intra-ion states can release photons whose wavelength corresponds directly to the change in energy. Thus, wavelength discrimination (in the form of CL spectroscopy) enables trace elements or defects to be differentiated.
The concentrations of elements required to produce measurable peaks in a CL spectrum can be orders of magnitude lower than those measurable by x-ray microanalysis in energy-dispersive (EDX) or wavelength-dispersive (WDX) mode.
Spatial and spectral information
Some CL detectors collect spatial and spectral information within the same data set. Spatial information (in the form of images or maps) allows the contrast of different phases, plus the visualization of defects, zoning and internal structures of solids. In contrast, spectral information allows the detection of trace elements, their valence, and structural position. The terminology to describe this data depends on the spectral information contained in the dataset:
 unfiltered CL image revealing internal texture, b) and c) wavelength-filtered CL images at 404 and 575 nm respectively corresponding to Er3+ and Dy3+ trace rare-earth ions; the wavelength-filtered images have been processed by removal of the ZrSiO4 background signal at 650 nm. The Er3+ and Dy3+ concentrations were in the range 10 – 300 ppm, as determined by microanalysis in the electron probe microanalyzer. Schematic representations of the acquisition modes used are displayed immediately below the respective CL image. Images captured using the MonoCL4™ Elite detector and provided courtesy of Michael Zanetti, Washington University in St. Louis and the McDonnell Center for the Space Sciences, Earth and Planetary Science Dept.")
Wavelength-filtered imaging
In a wavelength-filtered image, spatial information is captured using only a defined wavelength or narrow range of wavelengths. Typically, wavelength-filtering is performed by detecting the light that passes through the wavelength selecting (exit) slit of a scanning spectrometer or an optical transmission filter. The use of an optical spectrometer provides the greatest flexibility in the selection of the wavelength and wavelength range (bandpass). Still, images generated in this way have poorer signal-to-noise ration than an equivalent image captured using an optical filter due to losses at each optical surface through the spectrometer. However, it is impractical to have hundreds (or thousands) of optical filters with the desired transmission parameters, so scanning spectrometers are used widely.
Wavelength-filtered images enable the spatial distribution of an emission center to be mapped. Images of more than one emission center may be captured through repeated scans of the electron beam with the filtered wavelength changed for each scan. In this manner, emission centers that have well-separated emissions may be mapped. As shown in Figure 5, the spatial distribution of Dy3+ and Er3+ rare-earth ions in a melt glass zircon are mapped using wavelength-filtered imaging at 575 and 400 nm, respectively.
Wavelength-filtered images may be captured in a few tens or hundreds of seconds.
Color imaging
In color imaging, spatial information is captured at three wavelengths corresponding to the red, green, and blue components of the visible spectrum. The three components are recombined to form a color image in much the same way as the viewing screen of color television. Some specialized detectors, such as the ChromaCL2™ detector, capture the color components simultaneously to enable color image capture during a single pass of the electron beam. More typically, sequential scans of the electron beam are required with color components contributing to the signal changed between scans; color images may be captured in a few tens or hundreds of seconds.
Application
Spectrally resolved CL imaging has been used extensively in metamorphic petrology applications: identifying mineral distributions and revealing primary and secondary growth features, e.g., deformation, recrystallization, fluid flow, alteration, and mineral neoformation. The additional spectral information assists the geologist in accurately interpreting CL data. In this case, the unfiltered CL Imaging of plutonic quartz (Figure 6a) reveals regions with lower CL intensity in the grain interiors and along with healed fractures. At first sight, the two regions appear equivalent (same grayscale intensity). However, color imaging reveals that the CL emissions are very different, with the regions adjacent to healed fractures exhibiting red colors; indicative of recrystallization at low temperatures (Figure 6b).
 Unfiltered and b) color cathodoluminescence images of the same region of igneous quartz (plutonic granite); inset schematics represent the mode of data acquisition with the color image formed using three spectral components corresponding to red, green and blue wavelengths). The arrows indicate two regions of the mineral that, in an unfiltered CL image, appear equivalent. However, the additional spectral information available in the color image reveals that the two regions are distinctly different, reducing the risk of incorrect interpretation. Images captured by ChromaCL2 detector and provided courtesy of Dr. Juergen Schieber, University of Illinois.")
CL imaging has been used extensively in the analysis of quartz where detrital and authigenic quartz is readily discernable. In recent years, color CL imaging has enabled assessment of metamorphic grade where inherited CL signatures are found to fade with increasing metamorphic grade. For example, detrital blue CL colors fade with increasing temperature and are overprinted by red tones until fresh metamorphic blue CL appears at Staurolite grade at the margin of grains, and the detrital signature is lost (Figure 7).

Recently, this has enabled the use of color CL to infer the provenance of shales and mudstones using even silt-sized grain populations. The visible colors and textures allow us to assess whether a population of quartz grains is metamorphic, volcanic, or plutonic derived, and even reveal information about the intensity of metamorphism. Traditionally provenance assessments of shales utilized bulk rock geochemical parameters, prone to bias by weathering and diagenesis. Provenance determination via SEM Color CL utilizes highly resistant grains and is much faster—it constitutes a superior methodology.
Spectrum imaging
Sometimes referred to as hyperspectral imaging or spectrum mapping
A ‘spectrum’ or ‘hyperspectral’ image is the term given to a dataset containing both spatially- and spectrally- resolved information. It can be considered a two-dimensional array of spectra, or (equivalently) as an aligned stack of wavelength-filtered images; Figure 8 is a conceptual representation of this data cube. Somewhat arbitrarily, the term hyperspectral image was coined to describe a data cube containing many wavelength bands (typically >20) in contrast to color imaging or multiple wavelength-filtered imaging where spectral information is limited to one or a few wavelength bands only.
 showing the stack of wavelength-filtered images as horizontal slices and the component spectra as vertical columns; b) wavelength-resolved acquisition mode where an array detector is used to capture complete CL spectra on a point-by-point basis; c) wavelength-filtered acquisition mode where a photomultiplier detector is used to capture an aligned stack of wavelength-filtered images.")
Several electron microscopy/spectroscopy signals also lend themselves to spectrum imaging, including x-ray and electron energy loss spectroscopies. CL spectrum imaging was introduced in the 1990s in the analysis of optoelectronic semiconducting materials. It is now widely used in this field, with a strength being the ability to map shifts in emission peak wavelength due to spatial variations in properties such as elastic strain, alloy composition, electric field, or temperature. While this specific feature is less useful when looking at minerals, there are still several advantages to the technique which have resulted in its increasing use in geoscience.
Advantages of hyperspectral imaging
The most obvious benefit of measuring CL in hyperspectral mode is that all spatial and spectral information is captured in a single measurement; no a priori knowledge of the specimen is required. Even if you consider a spectrum image to be nothing more than many discrete wavelength-filtered maps of the sample, there may, for example, be small inclusions within the mineral that are the only areas that luminesce at a particular wavelength. Both wavelength-filtered imaging and (point) spectroscopy would most likely miss these features, whereas the spectrum imaging approach would capture this information and could be revealed in data analysis performed at any time later.
A further benefit of the spectrum imaging mode is the ability to deconvolve spectral features, allowing the mapping of the intensity of overlapping peaks, or separating peaks from backgrounds. Such deconvolution can be achieved through either peak fitting or the use of multivariate statistical analysis methods (discussed in detail elsewhere)
Despite the obvious advantages to the spectrum imaging approach, and its wide use in material science and nanophotonic studies, there remains only modest uptake in geoscience research; partly been driven by the (historical) cost of commercial CL detectors with spectrum imaging capabilities but, perhaps more pertinently, the necessary reduction in mapping speed made even maps with modest spatial sampling impractical to acquire, e.g., maps formed with 256 x 256 pixels (65,536 pixels in total) sampled at 1 spectrum/s, requires 18 hours! However, the release of the Monarc™ detector looks set to change practices in geoscience.
The optical design of many commercial CL systems places stringent requirements on the co-alignment of the sample, CL system and the optic axis of the SEM; failure to align all components leads readily to light losses >98%. This multi-part alignment process has always been a manual process that, in practice, few were able to achieve. This severe limitation of all previous spectroscopic-CL systems for the SEM was recognized and addressed in the development of the new Monarc detector: Auto-alignment methods have been developed to ensure that ideal alignment of all three components is achieved independent of the sample and user expertise. Software algorithms identify (and track) the center of the electron beam scan pattern, aligning the CL collection mirror to it and bringing the specimen to the ideal focal point of the CL system. This effective method of alignment guarantees optimum collection conditions thus greatly reducing the acquisition time per spectrum as optical losses associated with misalignments are avoided. This seemingly simple step makes spectrum imaging a practical acquisition method for almost all samples and all users with even lowly luminescent samples such as quartz routinely analyzed using the Monarc system in tens of minutes rather than tens of hours.
Conventionally, spectrum image data acquisition has been collected on a pixel-by-pixel basis, one (wavelength-resolved) spectrum at a time using an array detector. Array detectors capture 1024 – 2048 wavelengths (colors) in parallel with high spectral resolutions (0.1 – 1 nm) but are limited to acquisition rates ~5 ms/pixel due to limitation in readout speed of array detectors. However, many rocks and minerals exhibit spectra with natural line widths 10 – 150 nm full width half maximum; far broader than the instrument spectral resolution.
The Monarc detector offers the capability to collect spectrum images using an array detector (in the method described above) however, an alternative approach to collecting spectrum images is also included that potentially offers much higher acquisition rates with lower spectral resolution (but still commensurate with the requirement for many minerals). Rather than filling up the spatial-spectral data cube with wavelength-resolved spectra on a point-by-point basis, we collect a series of (aligned) wavelength-filtered maps and refer to this acquisition method as wavelength-filtered spectrum imaging. In this acquisition mode, a PMT detector is used to collect n wavelength-filtered CL images whose pixel time in each image slice can be collected thousands of times faster than an array detector. This approach enables spectrum images with 167 wavelength channels to be collected up to 30x quicker than the wavelength-resolved approach. Of course, the number of wavelength channels sampled may be defined by a user, and in the example shown in Figure 9—a polished zircon grain—42 wavelength channels were enough to resolve almost all spectral features but with >70x higher spatial sampling.
Recently, quantitative thermobarometry of quartz has proven possible by the quantification of titanium trace element concentrations using hyperspectral imaging, deconvolving the 2.72 eV peak associated with titanium.
 – d) True-color representation of two hyperspectral CL data cubes of the same polished zircon grain. Images a) and b) were captured using the wavelength-resolved spectrum imaging mode, schematically represented in Figure 8b and c) and d) were captured using the wavelength-filtered spectrum-imaging mode represented schematically in Figure 8c. Images b) and d) are close up of the region contained within the blue dotted square on images a) and b), respectively. Images e) and f) are two spectra extracted from the regions of the spectrum images indicated by the red rectangle in c) and d). The same spectral features are identified in both data sets and can be described by four peaks (two gaussian and two Lorentzian) with the peaks at 2.15 and 2.51 eV corresponding to Dy3+ rare-earth ion. The two hyperspectral data cubes were captured in 150 s using the Monarc detector.")