High-speed composition and chemical analysis of Si/STO/PZT with GIF Continuum
Introduction to the GIF Continuum
The GIF Continuum® series represents the next generation of electron energy loss spectroscopy (EELS) and energy-filtered transmission electron microscopy (EFTEM) systems from Gatan. Utilizing Gatan's exclusive CMOS detector technology, the GIF Continuum pushes the boundaries of EELS and EFTEM data fidelity and acquisition speed. Proper detector optimization combined with an improved scintillator/fiber optic imaging stack unlocks spectral acquisition rates as high as 8000 spectra per second with nearly 100% efficiency and low added noise. These components also result in immense data quality and productivity enhancement over previous CCD-based GIF spectrometers.
The GIF Continuum extends the analytical possibilities of EELS and EFTEM. The reduced-noise electronics improve the sensitivity of EELS when used for trace element analysis and chemical analysis, where high-quality data is essential for observing energy-loss near edge fine structure (ELNES). Furthermore, the high spectral acquisition rates translate into rapid collection of detailed spectrum images, removing the limitation of only examining small sub-regions to avoid artifacts such as sample drift and beam damage. The newly designed energy-selecting slit mechanism allows for the collection of individual spectra covering energy ranges up to 3000 eV, making spectrum images more data-rich than ever. These technical advantages extend to energy filtered images and diffraction patterns, making in-situ EFTEM and in-situ 4D STEM approachable techniques when using the GIF Continuum.
Core-loss EELS analysis of piezoelectric ceramics with the GIF Continuum
Piezoelectric ceramics, such as PbZrxTi1-xO3 (PZT), are a key materials system in sensor and transducer applications, among others. The atomic coordination and chemical oxidation state of elements in piezoelectric materials significantly affect piezoelectric properties, and EELS is an ideal characterization technique for providing this information. Unfortunately, EELS analysis of this sample is challenging due to the mix of light and heavy elements in the compound. The primary edges are very high energy-loss features, with the Zr L and Pb M edges located at 2222 eV and 2484 eV, respectively. Furthermore, the Ti L edge at 456 eV and O K edge at 532 eV are separated from the Zr and Pb edges by almost 2000 eV, which complicates acquisition. It is nearly impossible to collect spectra with a good signal-to-noise ratio at such high energy losses and over such a broad energy loss range using previous generation, CCD-based systems. However, the improved capabilities of the GIF Continuum are used here to overcome these hurdles and give a complete analysis of a Si/SrTiO3/PbZr0.5Ti0.5O3 (Si/STO/PZT) structure.
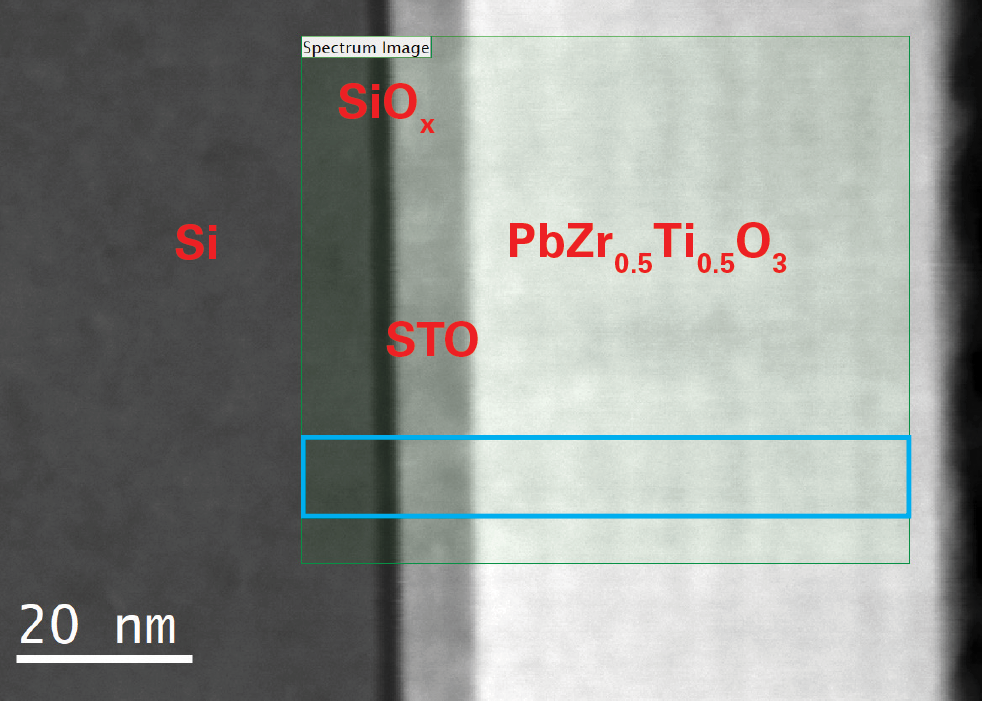
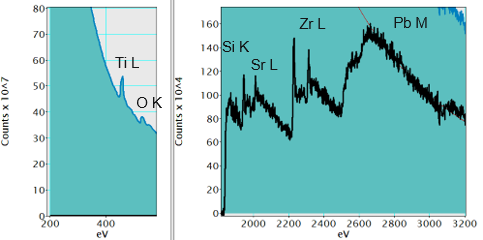
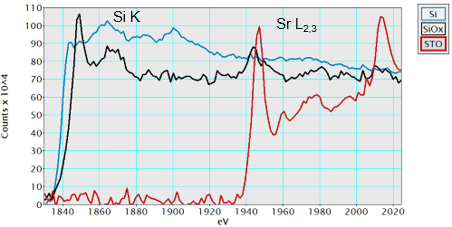
The HAADF STEM image in Figure 1 shows the Si/STO/PZT stack. The green region labeled Spectrum Image indicates the EELS analysis region (138 x 120 pixels in size, 5 ms exposure per pixel). Figure 2 shows an integrated spectrum across the blue region in Figure 1. This spectrum spans an energy range from 200 – 3200 eV and includes all elemental edges of the Si/STO/PZT sample. Furthermore, all of the edges in the spectrum, even when >1800 eV, have sufficient signal-to-noise ratios to accurately conduct any necessary data processing; such as multiple linear least squares (MLLS) fitting, fine structure analysis, and elemental quantification and mapping. For example, mapping using MLLS fitting effectively separates the overlapping Si K and Sr L edges shown in Figure 3. Also, the clear shape change and energy shift of the Si K edge in Figure 3 reveals the presence of a SiOx layer in the Si/STO/PZT stack.
The Ti L, O K, Si K, Sr L, Zr L, and Pb M edges were then mapped to show the elemental distribution in the Si/STO/PZT structure. As the spectra collected at each pixel contain all elemental edges, individual raw element maps can be easily combined to yield the detailed elemental distribution map seen in Figure 4. This map was collected with a very short (5 ms) exposure time per pixel and total collection time of less than 90 seconds. No filtering or other data enhancement process was needed to improve the quality. The map reveals the SiOx region as an interlayer at the Si/STO interface, in addition to periodic changes in Ti concentration that correlate with image contrast changes seen in Figure 1.
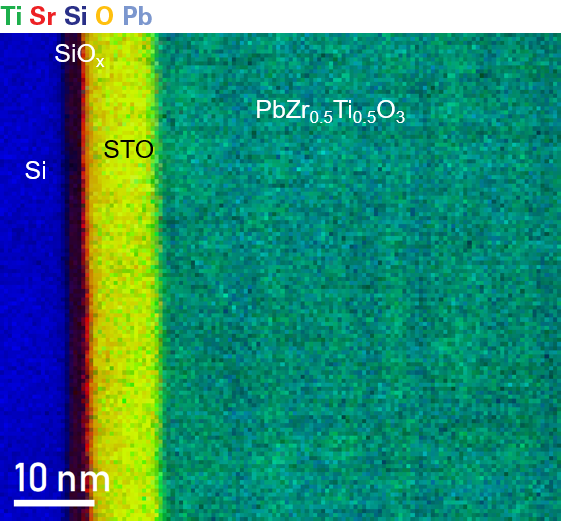
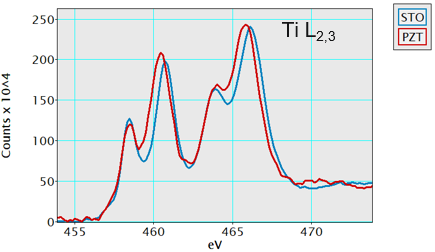
Figure 5 shows a closer examination of the Ti L2,3 edges in the STO and PZT regions. There is strong crystal field splitting in each edge. However, the fine structure also shows slight shifts in peak maxima and changes to the peak intensity. These differences indicate the different atomic arrangement of Ti4+ in STO and PZT.
The GIF Continuum distinction
The GIF Continuum significantly extends the analytical possibilities with EELS, as seen here in the spectrum imaging of the Si/STO/PZT stack. The newly redesigned energy slit assures proper alignment of spectra in the optical path and extends the energy range that an individual spectrum can cover to 3000 eV. Additionally, the GIF Continuum’s all-new detector stack technology significantly improves sensitivity while reducing noise and can provide high-quality spectra when using low beam currents or fast acquisition times.
The GIF Continuum delivers a data-rich analysis of the Si/STO/PZT structure. The advantages of the GIF Continuum extend to all current samples of interest for EELS characterization and also to samples where EELS analysis was not possible using previous spectrometer technology.
Special thanks to Dr. Paola Favia at IMEC Belgium for providing the TEM specimen.