"Will electron energy loss spectroscopy (EELS) help me measure the carbon content of my steel sample?"
"Can I map the platinum in my nano-scale catalyst particles with my TEM energy filter?"
"Do I need a field-emission TEM in order to detect an interfacial boron layer in my device structure using EELS?"
These are the sorts of questions that frequently plague analytical microscopists. The inability to answer these questions a priori often leads to many fruitless and expensive wasted hours in the TEM lab. Now there is a tool to help you settle many of these questions without having to prepare a single TEM specimen: EELS Advisor simulation software.
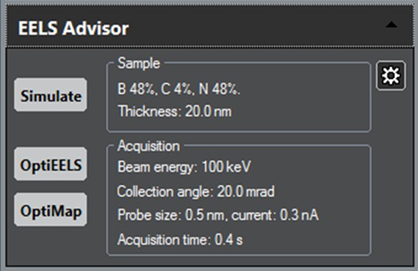
EELS Advisor software is based on the latest advances in the theoretical modeling of electron energy loss spectra (see reference below). It encapsulates the complexity of the EELS technique and presents a clear and approachable interface (see screenshot of UI palette below) for posing and answering common questions about EELS experiments.
EELS Advisor is a plug-in module for the DigitalMicrograph® software. As such, it can be easily added to existing DigitalMicrograph installations through purchase of the appropriate EELS Advisor license. EELS Advisor module is available in both on-line and off-line variants and can be added to either type of DigitalMicrograph installation. It is a perfect complement to any installation that already includes the Gatan EELS Analysis module.
The EELS Advisor module is included as an optional component in the DigitalMicrograph 1.3 release. Although this maintenance release of the DigitalMicrograph installer is available free of charge to all existing DigitalMicrograph 1.x customers, your DigitalMicrograph license set must include the EELS Advisor item in order to unlock and install this component of DigitalMicrograph 1.3. The EELS Advisor can be purchased from your local Gatan sales representative.
EELS Advisor offers three main functions: Simulate, OptiEELS, and OptiMAP. Each function is suited to answering a different type of EELS analysis question. These three modes of use are illustrated in the examples below.
Simulate: Synthesis of EELS spectra
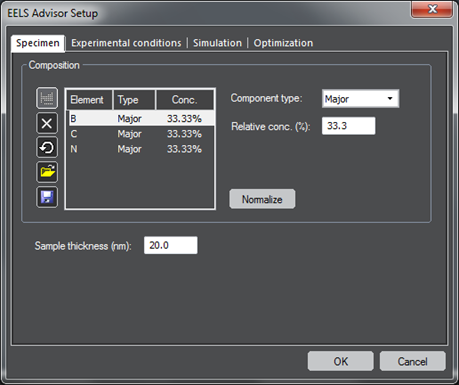
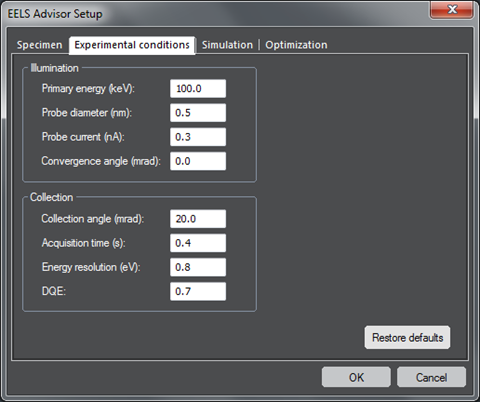
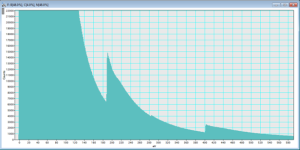
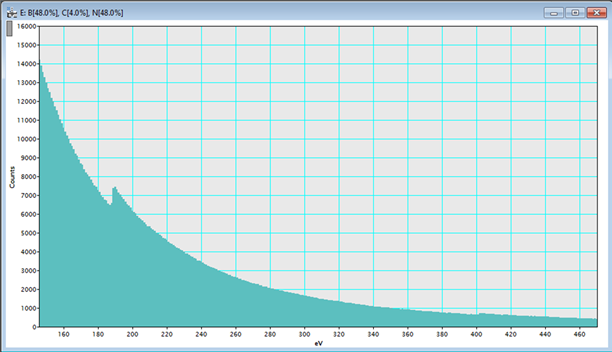
To simulate a spectrum, simply enter basic information into the Specimen and Experiment panels of the EELS Advisor options dialog, as illustrated above. Click OK and then the Simulate button on the EELS Advisor palette to yield a calculated spectrum in just one or two seconds. Using the applicable tools of DigitalMicrograph, you can explore and analyze such simulated spectra just like measured EELS spectra, as illustrated below.
Note that the carbon K edge in this case is virtually impossible to detect. With this simulation, you can quickly and efficiently conclude that it probably wouldn't be worthwhile to make a TEM specimen of this material in order to attempt an EELS measurement of its carbon content.
OptiEELS: Establishing the best experimental parameters for EELS acquisition
After performing a simulation like the one above, you may still wonder whether your proposed measurement would have been possible, if only you had chosen the experimental conditions judiciously to maximize the signal of interest. This is the type of question that the OptiEELS function is ideally suited to answer.
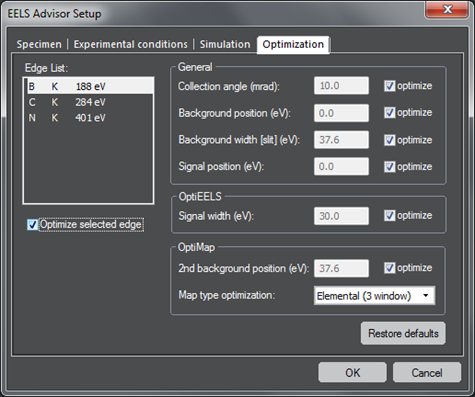
Simply go to the Optimization panel of the options dialog to tell the software which parameters in your experimental setup you are free to vary, as illustrated at left. Click OptiEELS and after a few seconds of calculation, EELS Advisor will tell you how to optimize the signal of interest and whether the signal-to-noise ratio (SNR) of that feature will be sufficient to be able to draw any firm conclusions. These results are output in an annotated DigitalMicrograph image document as shown below.

OptiMAP: Determining the best conditions for EFTEM elemental mapping
Suppose you decide that it would be useful to try to map the chromium in the material you have been considering so far. Is this possible? If so, what is the best way to collect energy filtered images for such a map? To answer these questions, use the OptiMAP function. This function takes the sample and experimental information you enter and in a few seconds calculates the optimum slit width and energy positions for the component images of a map. Again, it will also estimate the SNR of the signal you intend to map so that you can decide whether the map data are likely to be worth pursuing. The output of OptiMAP is also a DigitalMicrograph image document similar to the OptiEELS result. An example is shown below.

Reference
Menon, N. K.; Krivanek, O. L. Synthesis of Electron Energy Loss Spectra for the Quantification of Detection Limits. Microscopy and Microanalysis 8:203; 2002.
