Complete understanding of light emission with nanoscale spatial resolution
Use of Wavelength- and Angle-Resolved Cathodoluminescence for Spectroscopic Analysis of the Emission Pattern of a Nitride Semiconductor Micropillar Array
Lee, J.; Bertilson, M.; Stowe, D. J.; Worsley, T.; Hunt, J. A.
Introduction
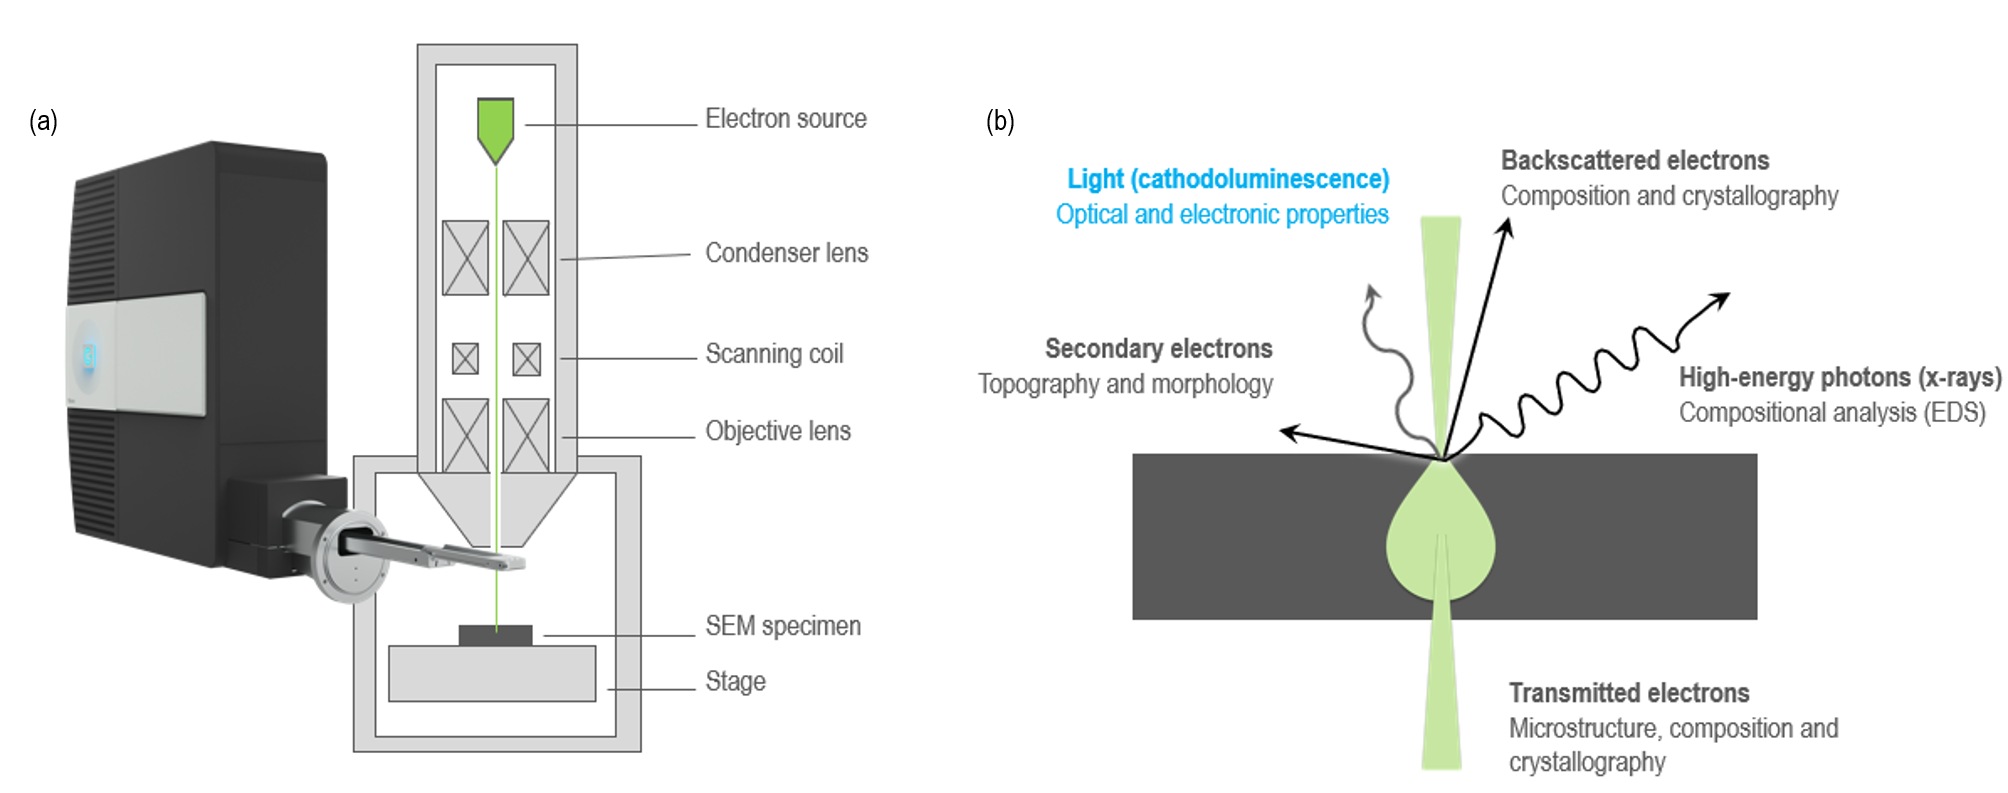
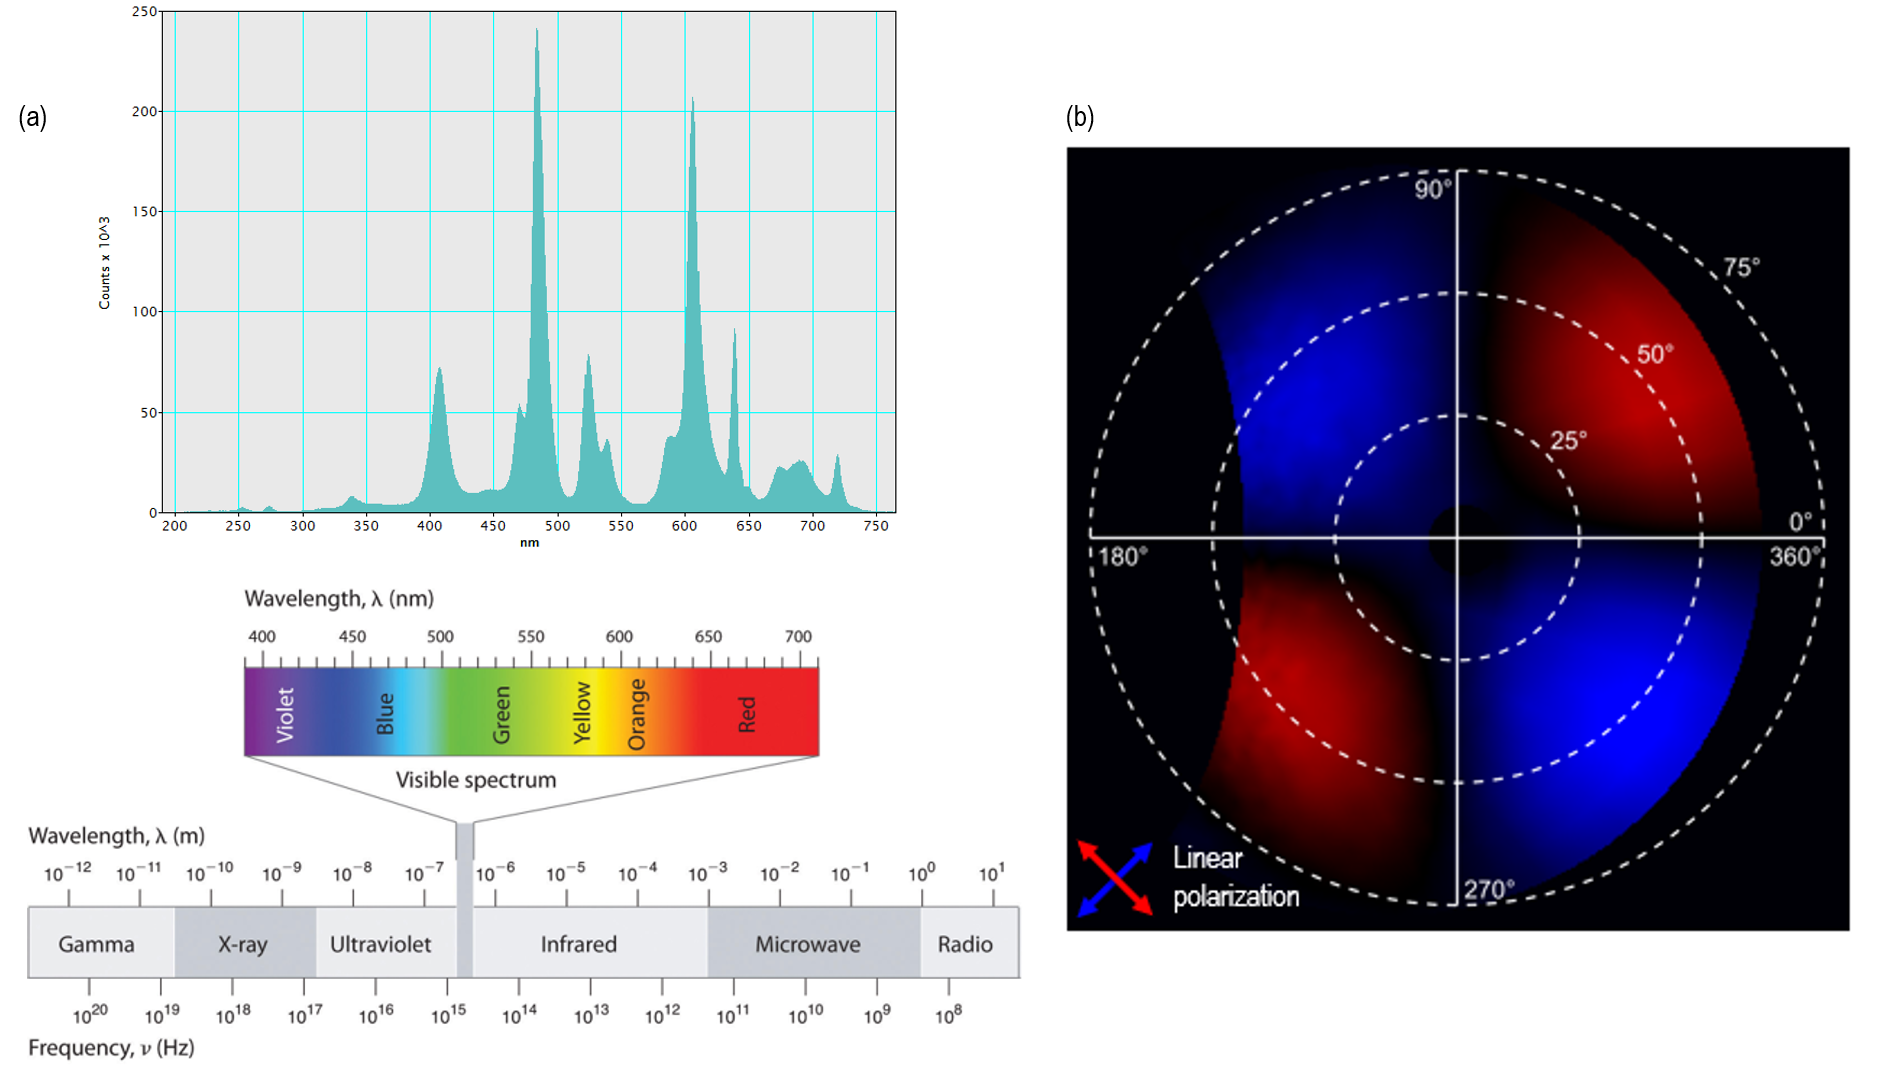
Spectroscopic cathodoluminescence (CL) — which analyzes the wavelengths of light emitted from a sample (typically) stimulated by the electron beam of a scanning electron microscope (SEM) — is widely used to study material quality and compositional variations in compound semiconductors as well as light-matter interactions in nanophotonic applications. Traditionally, CL detectors only analyzed the wavelength distribution of the emitted light. However, recent advancements in detector technology now enable researchers to determine the direction (angle) and polarization distributions (Figures 1 and 2).


Previously, an optimized method was shown to capture the wavelength and angular distributions simultaneously over a large numerical aperture, with virtually no loss in resolution using a technique termed wavelength- and angle-resolved cathodoluminescence (WARCL) [1]. Here, we extend the WARCL technique to study the emission pattern as a function of wavelength across a nitride semiconductor micropillar array.
Light emitting diodes (LEDs) are currently displacing incandescent and fluorescent bulbs in many lighting applications. However, devices based on micropillar arrays may offer up to a 30x improvement in energy efficiency with a color rendering index (CRI) that will meet or exceed the strike regulations in California and beyond (90+). Therefore, microLED arrays in the form of micropillars are an attractive technology for use in displays since they provide enhanced light extraction and controllable emission patterns.
To ensure optimal light extraction and uniform color rendering at the desired emission angles, it is necessary to correlate and control the structural properties of micropillars with spectroscopic analysis of the emission patterns. We can do this by utilizing the unique WARCL mode of the Monarc CL system.
Results and discussion
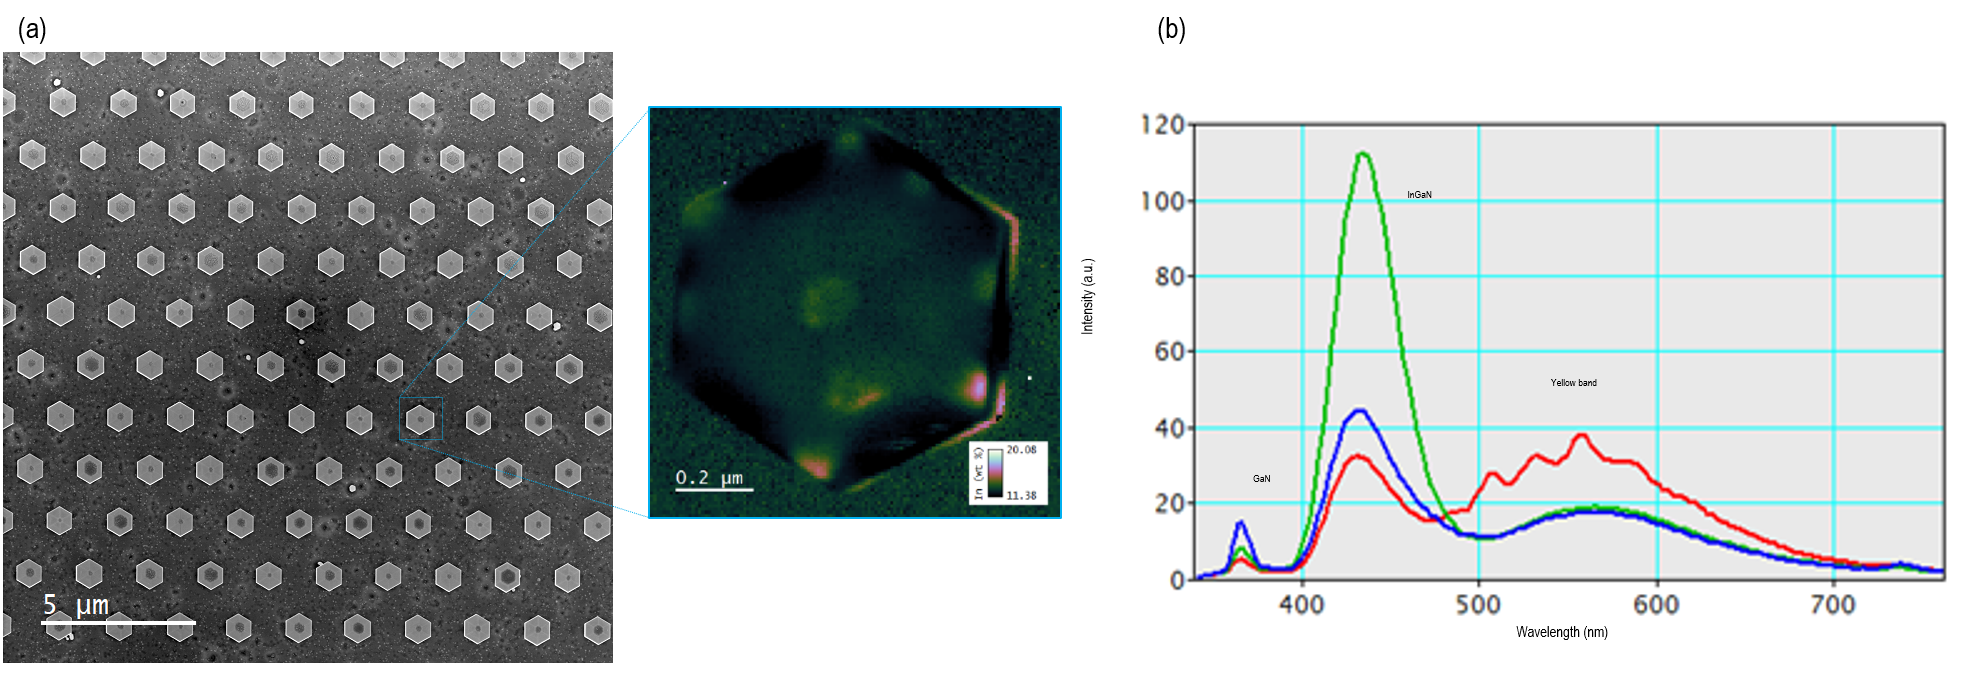
We analyzed a 10 x 10 array of core-shell GaN-InxGa1-xN micropillars using the Monarc CL system attached to an FE-SEM (Figure 3a). Each micropillar consisted of a truncated hexagon pyramid atop a hexagon prism nominally 1 x 2 µm (W x H). On inspection, the micropillars displayed slightly irregular cross sections and up to 27x variation in the area of the truncated pyramid face; the array exhibited a periodicity of 2 µm.

Intense light emission was observed across the visible spectrum (400 – 720 nm). This was dominated by a strong blue emission from the InGaN multi-quantum wells and a yellow band emission thought to be the result of luminescence from point defects (Figure 3b). Wavelength-resolved spectrum imaging was used to investigate the spatial variation in the InGaN emission wavelength from an individual micropillar. This analysis revealed significant variation in the InGaN emission wavelength associated with a change in alloy composition (Figure 3a). Using non-linear least squared fitting of the CL spectrum image, the indium fraction of the InxGa1-xN alloy was found to vary between x = 0.104 and x = 0.152; indium accumulation at the vertices of the hexagonal pyramid was observed.
The emission pattern from the micropillar array was captured using the angle-resolved (AR) CL mode of the Monarc system and revealed significant anisotropy (Figure 4). Six emission maxima were observed normal to the six {10-11} facets of the hexagonal pyramid; whereas emission in the direction close to the substrate surface normal was ~5x weaker.

The lack of spectral sensitivity in the ARCL technique prevents determination of the uniformity in emission color over the range of viewing angles. To overcome this limitation; we used the WARCL technique to reconstruct emission patterns at 670 wavelengths across the visible spectrum (spectral resolution ~0.63 nm). Figure 5 shows six emission patterns extracted from the reconstructed WARCL data set. By comparing the emission patterns at different wavelengths, strong variations were observed; e.g., the emission spectrum (color rendering) was found to vary as a function of the emission direction (viewing angle). A video representation of the emission pattern at full spectral resolution is shown below.

It is thought that the emission pattern by color varies according to the micropillar size, shape, quality, and periodicity. Further work is required to understand the relative contribution(s) of each parameter. However, it is clear that CL in the SEM offers multiple advantages as the emission properties of a single, or an array of, micropillars may be directly related to the structural properties.
Summary and conclusions
Nitride semiconductor micropillars offer great promise as microLED technology for wearable and scalable display applications. The results presented here demonstrate that in order to understand and control color rendering of these devices, it is important to correlate device structure with the wavelength-resolved emission pattern. Furthermore, the unique wavelength- and angle-resolved mode of the Monarc CL detector will play a critical role in design validation and quality control as microLED technologies gain momentum in the market.
References
[1] Bertilson, M.; et al., Microscopy and Microanalysis Conference Proceedings (2018).