Data courtesy of Dr. R. Williams, Ohio State University
Correlating microstructure with luminescence properties at the nanoscale
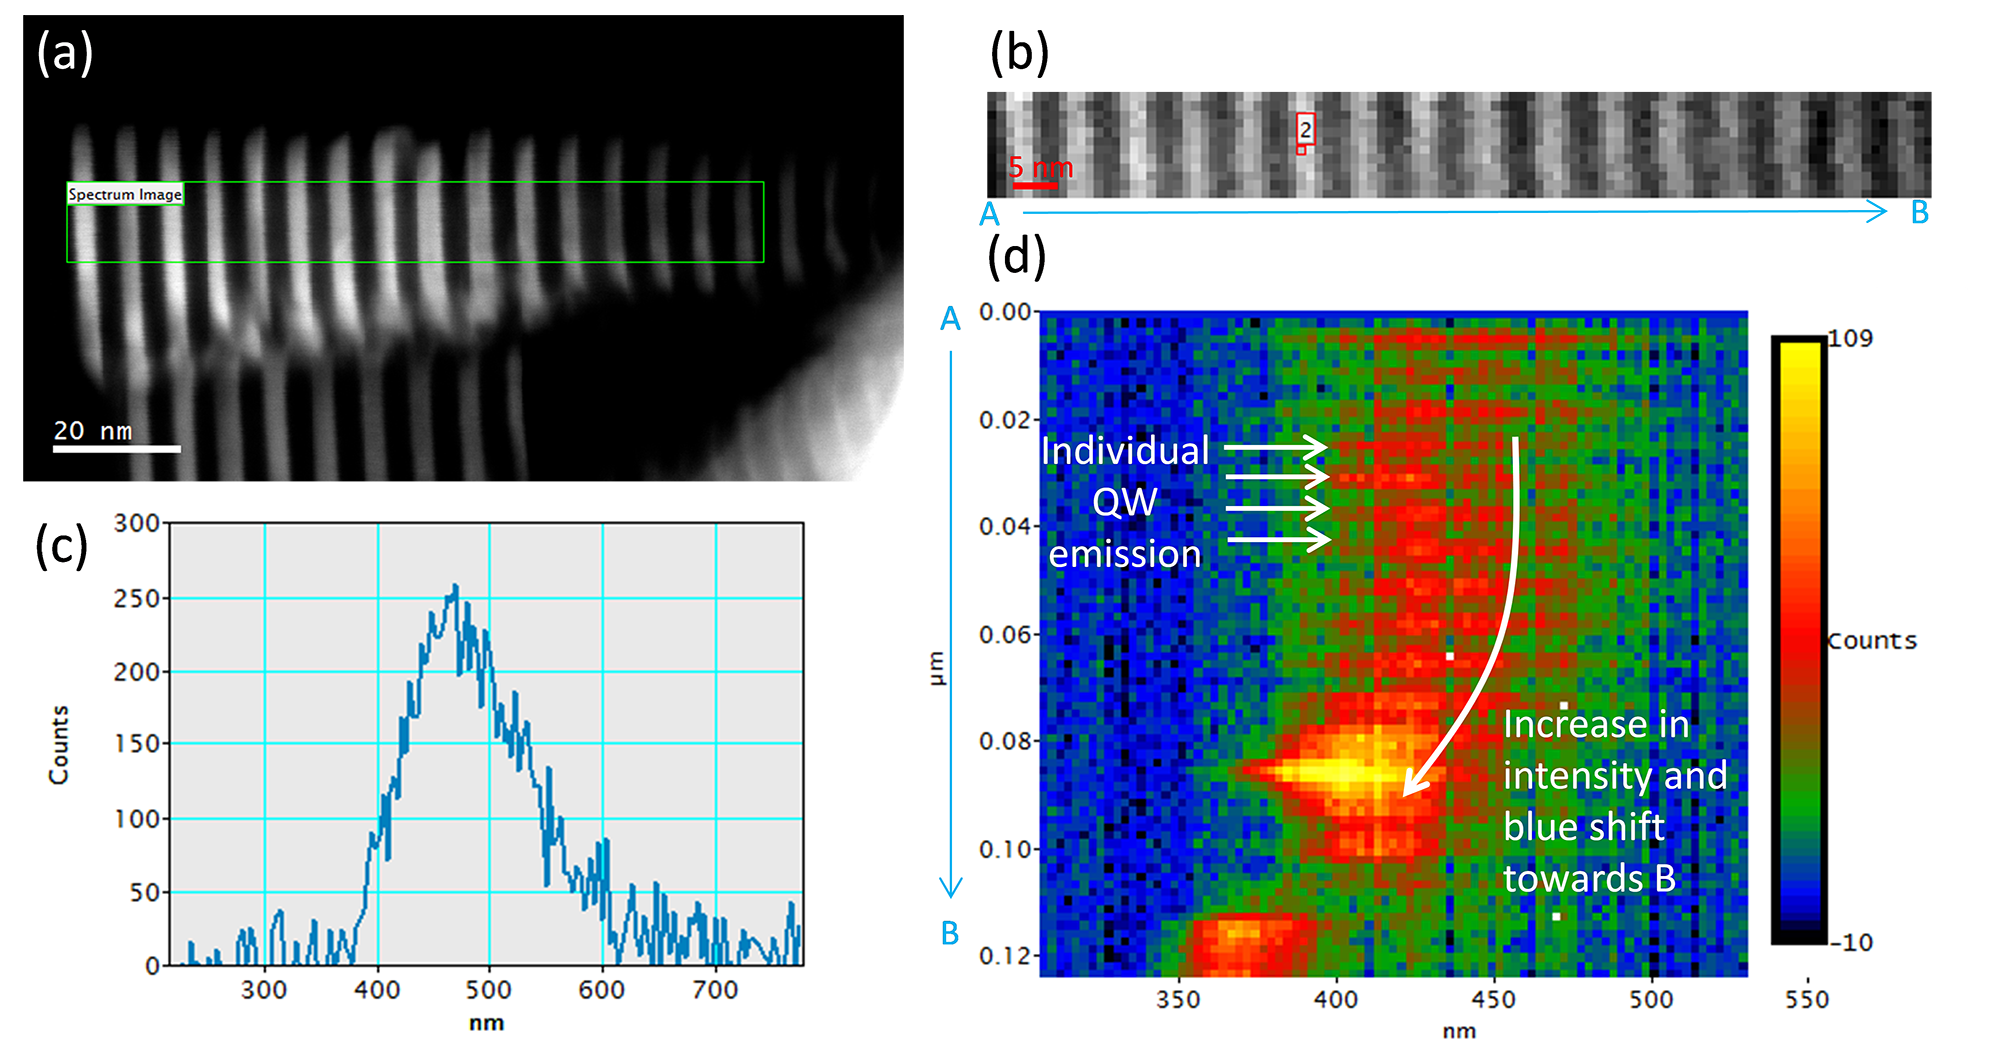
Cathodoluminescence analysis of a GaN/AlN nanowire in STEM (a) Dark field STEM image, (b) cathodoluminescence spectrum-image acquired from the region indicated by the green rectangle in (a), (c) A cathodoluminescence spectrum extracted from the spectrum-image, and (d) a projection of the cathodoluminescence spectrum with the information along the y-axis (radial direction) of the nanowire summed into a single value. The resultant data set shows the spectral information as a function of position along the nanowire length.

