
Automated statistical analysis of the emission properties of Micro-LEDs within an array
Instruments used
Monarc® Pro cathodoluminescence system
Background
Micro-LED (µLED) arrays have significant potential for high-brightness, high-contrast displays. These arrays contain thousands of miniature light sources (typically 0.2 – 50 µm), assembled onto a single substrate. However, achieving uniform brightness and emission wavelength across the entire array is challenging.
As Micro-LED dimensions decrease below 10 µm, characterization becomes increasingly difficult, while device efficiency can be affected by sidewall defects introduced during fabrication. Supporting process development therefore requires methods capable of evaluating the emission intensity and wavelength of hundreds and thousands of individual Micro-LEDs and correlating those results with structural and compositional information.
Here, we demonstrate how an automated approach using the Monarc Pro system to rapidly characterize individual devices within a Micro-LED array and generate statistically meaningful insights into device uniformity.
Materials and methods
A scanning electron microscope fitted with a Monarc Pro cathodoluminescence (CL) system was used to synchronously capture a secondary electron image and a CL spectrum image (SI) of an array of 132 Micro-LEDs. The CL-SI contains a complete emission spectrum at every pixel, enabling spatial variations in emission properties to be measured across each device and throughout the array.
The emission intensity and wavelength were determined at each pixel through non-linear least squares fitting using a centroid function (Figure 1a). The corresponding secondary electron (SE) image revealed hexagonal Micro-LEDs nominally 0.45 µm in width.
Image segmentation of the SE image was then used to identify individual Micro-LED devices in the CL-SI data. See the Image segmentation for enhancing spectrum image analysis application note for additional details.
From the segmented dataset, the mean emission intensity and centroid energy were calculated for each device and compiled into statistical distributions (Figures 1b and 1c). This object-based approach provides an efficient and consistent method for evaluating device-to-device variation across the array.
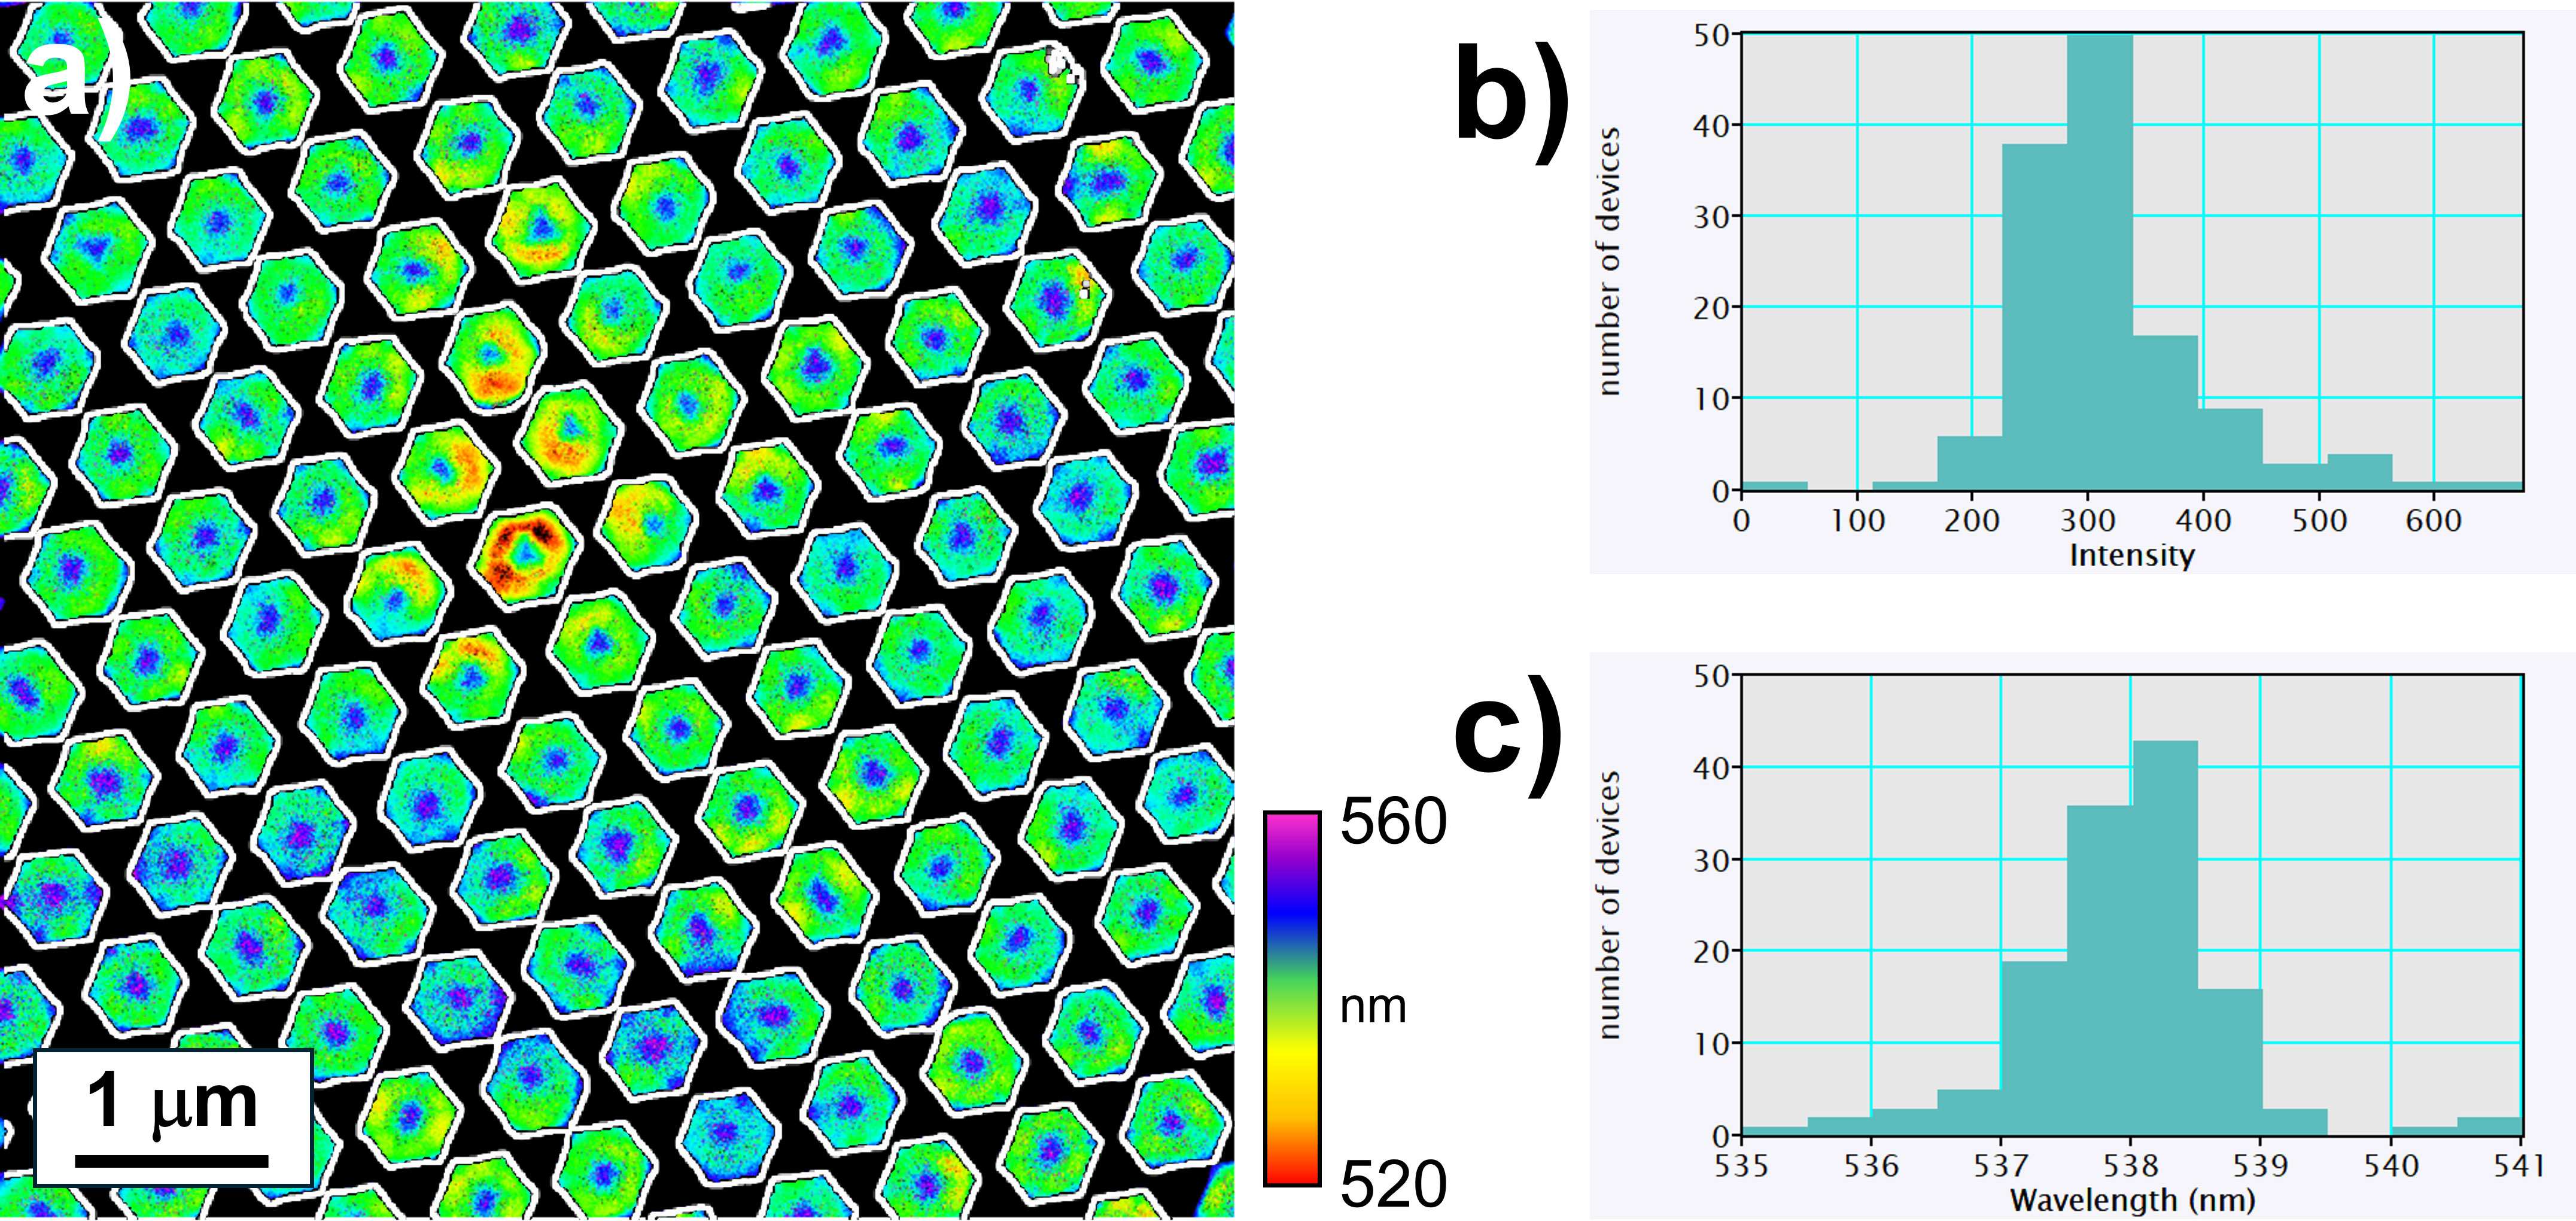
Figure 1. a) A composite image of the emission energy map (color) and the physical size and shape extracted from the secondary electron image by automated segmentation processes (black and white). b) A histogram of Micro-LED emission intensity and c) a histogram of Micro-LED emission wavelength.
Summary
Cathodoluminescence spectrum imaging combined with automated image segmentation enables statistical analysis of the emission properties of individual Micro-LEDs across an array. In this example, the emission intensity and wavelength of 132 devices were evaluated automatically, providing a quantitative measure of device-to-device variation.
The same approach can be extended to correlate physical characteristics, such as device size, position, and symmetry, with emission wavelength and intensity. In this way, complex, high-dimensional spectrum imaging datasets can be transformed into concise statistical distributions or figures of merit.
By automating device identification and analysis, this workflow enables faster, more consistent characterization and shortens the feedback loop between microscopy and process development.