
Revealing lithium distribution at the microscale with Cipher

Results and discussion
Assessing the applicability of Li-CDM to compound materials
The qBSE signal as a function of mean atomic number, , is plotted in Figure 2 with calculated using the modified electron approach of equation (1) (after [5]):
Equation 1.
where ai represents the atomic fraction of element i and x ≃ 0.7. In line with other publications (e.g., [6]), the qBSE signal was fitted to the function:
Equation 2.
where C and q are constants related to the SEM and detector settings.
For compounds with < 40, an excellent fit of the experimental data to the exponential function of equation 2 was observed with few—if any—outliers. However, for materials of > 40, although the experimental data continues to follow the general trendline, the increased scatter of the experimental data indicates that a large uncertainty would be expected in the Li-CDM calculation. Notwithstanding, it was confirmed that the Li-CDM is suitable for a wide range of metallic and non-metallic samples of < 40.

Evaluating the lithium content of lithium aluminate
Cipher was used to determine the lithium content in a lithium aluminate sample. The compositional analysis results are summarized in Table 1. The lithium content was determined to be 22.6 ± 3.5 at.% (9.5 ± 1.7 wt.%); within 2.4 at.% and only 0.9 wt.% of the nominal composition 25.0 at.% (10.5 wt.%).
| Li | Al | O | |
|---|---|---|---|
| By stoichiometry | |||
| at.% | 25.0 | 25.0 | 50.0 |
| By EDS | |||
| at.% | - | 29.6 | 70.4 |
| Std. dev. | - | 1.6 | 5.1 |
| Li composition-by-difference | |||
| at.% | 22.6 | 22.9 | 54.6 |
| Std. dev. | 3.5 | 1.0 | 4.0 |
Table 1. Elemental quantification results of LiAlO2 sample.
Evaluating the lithium content of Li-ion battery cathode materials
The NMC 811 powder analyzed consisted of approximately spherical 'secondary' particles of 5 – 30 µm in diameter. These secondary particles are agglomerates of smaller 'primary' particles that can be observed in a crystal orientation map collected by electron backscatter diffraction (EBSD) (Figure 3). The orientation map captured by the EDAX Clarity EBSD Detector reveals primary particles 200 – 2,000 nm in size with random crystal orientations and low/no gaps between primary particles.

Quantitative EDS analysis at select locations within NMC particles was performed and revealed O, Ni, Mn, and Co with little-to-no variation within or between particles that were analyzed (Table 2). No other elements were found to be present above the minimum detection level. The Ni:Mn:Co ratio of 8.07:1.00:1.01 was determined experimentally and was found to be consistent with the nominal 8:1:1 ratio.
| Expectation per nominal (at.%) | ||||||||
| Li | O | Ni | Mn | Co | Ni | Mn | Co | |
| - | 66.7 | 26.7 | 3.3 | 3.3 | 8.00 | 1.00 | 1.00 | |
| Experimental (at.%) | ||||||||
| O | Ni | Mn | Co | Ni | Mn | Co | ||
| Spot 1 | 73.3 | 21.3 | 2.7 | 2.7 | 7.89 | 1.00 | 1.00 | |
| Spot 2 | 74.4 | 20.3 | 2.6 | 2.6 | 7.81 | 1.00 | 1.00 | |
| Spot 3 | 72.8 | 21.8 | 2.7 | 2.7 | 8.07 | 1.00 | 1.00 | |
| Area 1 | 73.0 | 21.4 | 2.7 | 2.9 | 7.93 | 1.00 | 1.07 | |
| Area 2 | 71.7 | 22.9 | 2.7 | 2.7 | 8.48 | 1.00 | 1.00 | |
| Area 3 | 73.2 | 21.5 | 2.6 | 2.6 | 8.27 | 1.00 | 1.00 | |
| Mean | 8.07 | 1.00 | 1.01 | |||||
Table 2. Quantitative EDS analysis of six NMC particles. Analysis positions as shown in Figure 4.
The lithium content from six different NMC particles was determined using Cipher; analysis locations are shown in Figure 4. The mean lithium concentration was determined to be 22.5 at.% (5.7 wt.%) and within ~1.5 wt.% of the nominal composition value of 7.3 ± 0.3 wt.%.
Introduction
Lithium-containing compounds and alloys are critical to many key technologies of the twenty-first century, from Li-ion batteries used to power mobile electronic devices and cars to lightweight structural alloys. Progress in these fields has been remarkable, given the lack of a method to determine lithium content at the microscale. Commonly, energy dispersive x-ray spectroscopy (EDS) in the scanning electron microscope (SEM) is employed for microanalysis. However, this has not been possible for elements with atomic number (Z) <4 as the characteristic x-rays emitted (e.g., Li K at ~55 eV) are easily attenuated by the sample or the presence of an oxide layer or contamination and require the use of highly specialized detectors. Even so, a limit of detection of ~20 wt.% Li and the inability to perform quantitative measurements due to the dependence of the fluorescence yield on the Li bonding state present significant issues [1]. More recently, it has been suggested that elemental Li maps captured with these detectors are unreliable [2].
However, quantification of Li in the SEM was demonstrated recently by researchers at LKR/AIT using a composition by difference method using EDS and quantitative backscattered electron imaging (qBEI) [3, 4]. EDS analysis was used to quantify elements Z = 4 – 94, while qBEI was used to determine the mean atomic mass (the qBEI signal being a function of atomic number for Z = 1 – 94). The fraction of light elements (Z = 1 – 3) was calculated and assumed to be Li, given the MgLi alloy analyzed. Using this lithium by composition by difference method (Li-CDM), detection of <5 wt% Li was demonstrated with acceptable accuracy (~1 wt.%).
Gatan announced the Cipher® System that integrates the EDAX® Octane Elite or Elect Super EDS Detectors with the OnPoint® backscatter electron detector and a composition-by-difference module for DigitalMicrograph® software to quantitatively measure the lithium composition of a sample. In this article, we assess the accuracy of Li-CDM in a range of non-metallic materials and describe the latest results using Cipher to analyze the lithium content in a stoichiometric lithium aluminate and a lithium nickel manganese cobalt oxide powder commonly employed in cathode materials of Li-ion batteries.
Materials and methods
Quantitative backscattered electron measurements were recorded from 55 samples (Micro-Analysis Consultants Ltd) using Cipher. The samples included elemental, mineral, semiconductor, and alloy materials and ranged in atomic number from 4 – 83. The samples were mechanically polished and coated with a 2.0 nm thick carbon layer to avoid charging in the SEM using a PECS™ II system.
Quantitative lithium analysis using Cipher was applied to two samples that are available commercially—a high purity (>99.99%) LiAlO2 (100) crystal substrate and a powder form of Lithium Nickel Manganese Cobalt Oxide (NMC) with nominal Ni:Mn:Co ratio 8:1:1 and 5.7 wt.% Li (approximately 25 at.%).
The samples were prepared by broad beam argon milling using an Ilion® II or PECS™ II polisher and coated with a 2.0 nm thick carbon layer to avoid charging. Before sample preparation, the NMC 811 powder sample was embedded in epoxy to form a solid block. A field emission SEM was used to collect EDS and qBEI data at 20 and 25 kV, respectively, selected to ensure that all x-ray lines were excited efficiently while also providing comparable sampling volumes of the signals. Electron backscatter diffraction (EBSD) using the EDAX Clarity™ detector was also performed on a commercial NMC sample to reveal the crystal structure.
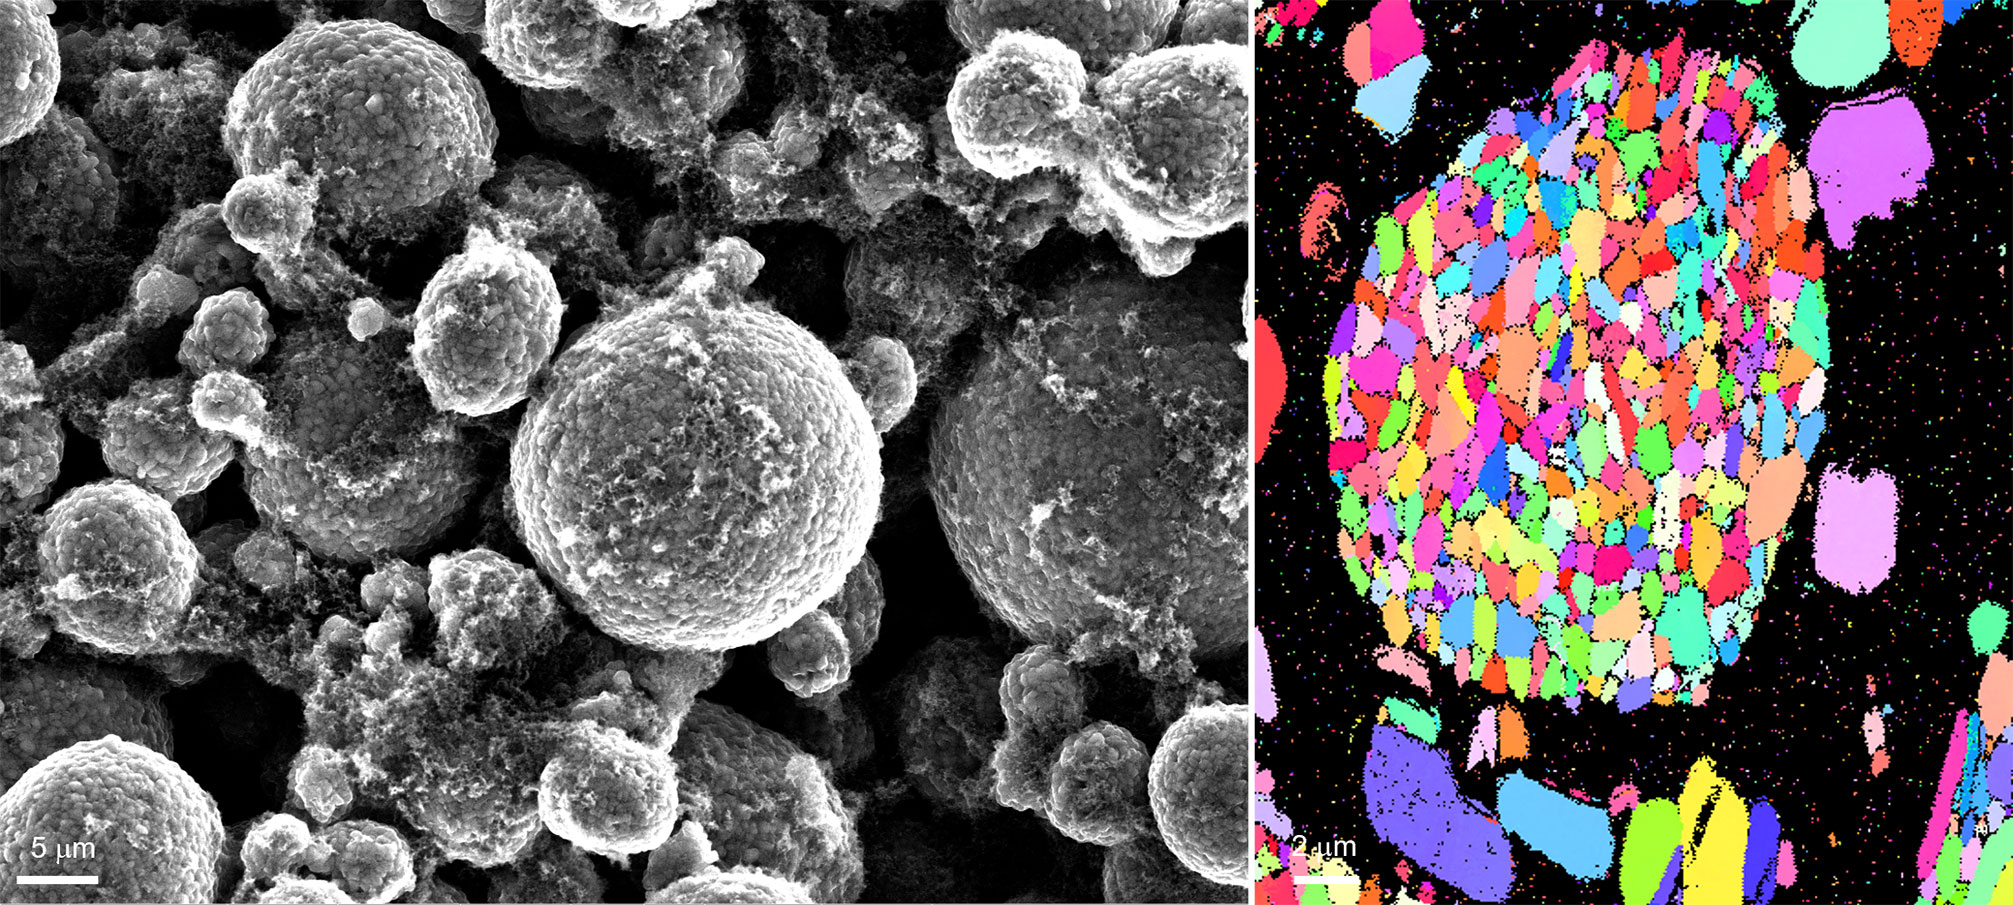
Figure 3. An example secondary electron image and b) orientation map of a lithium nickel manganese oxide powder sample.
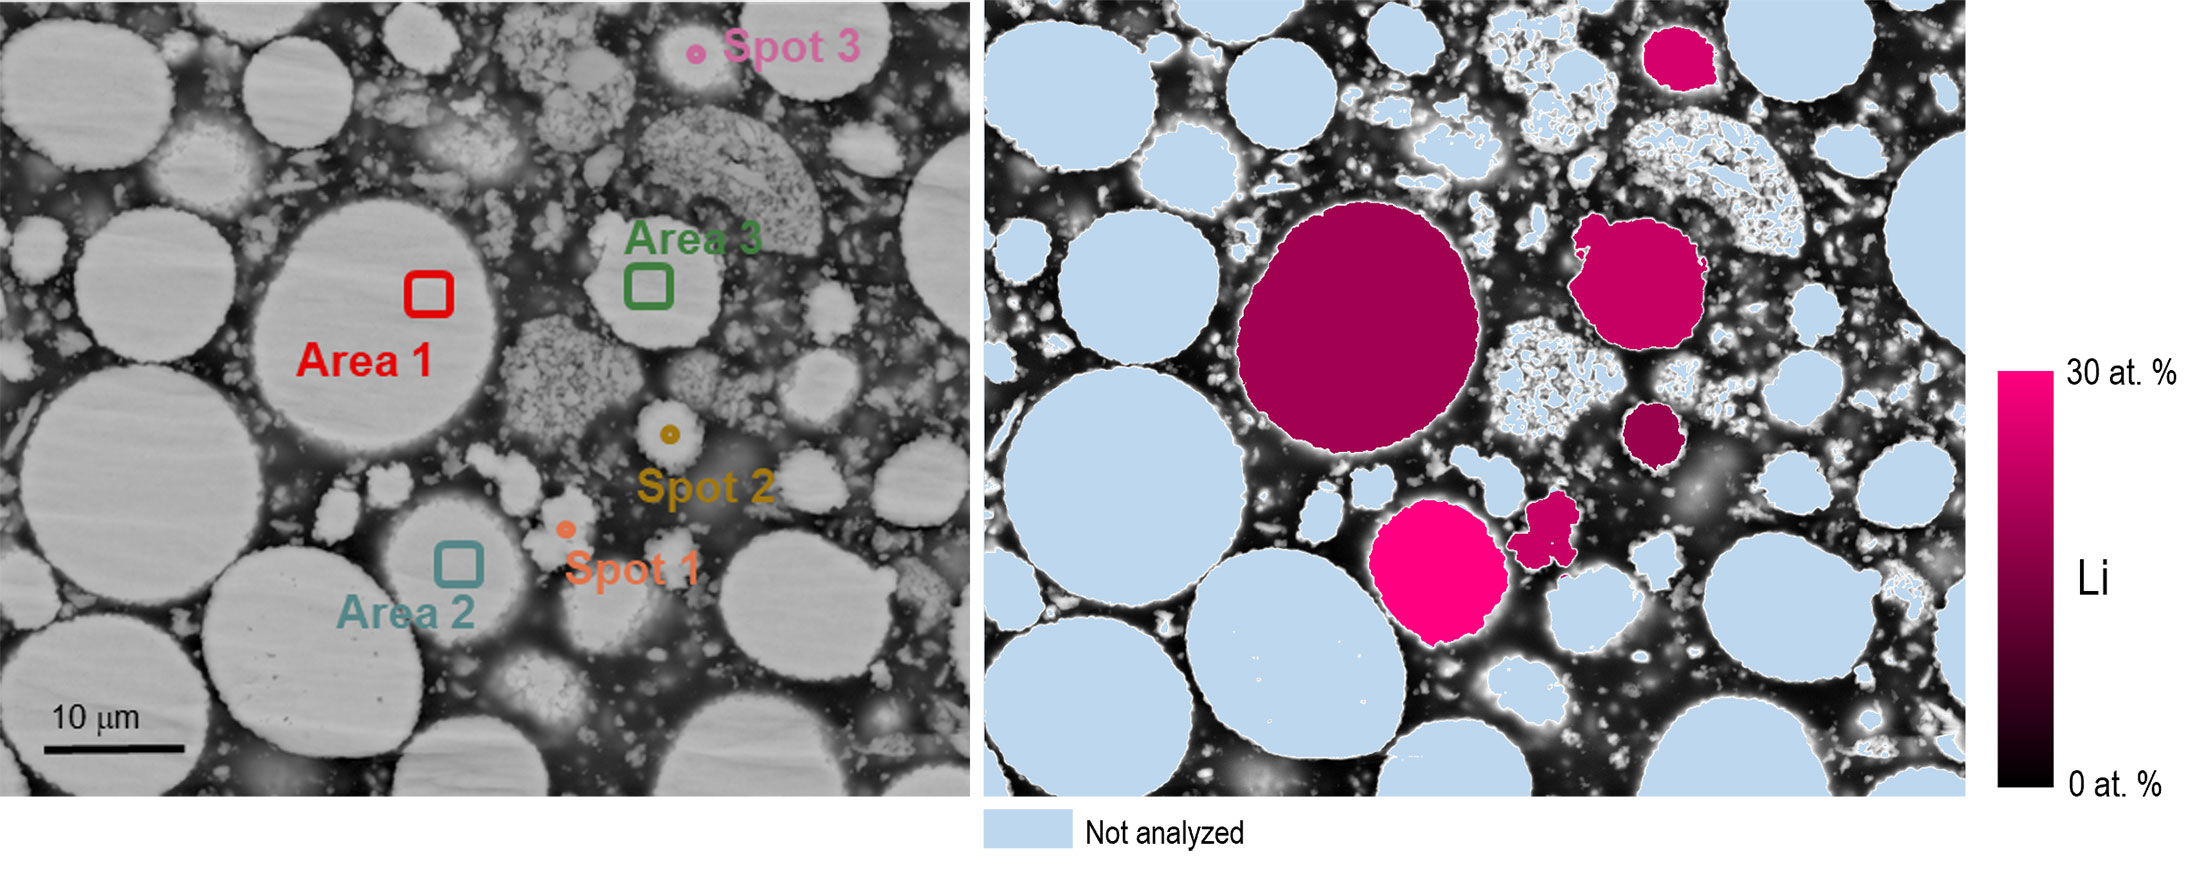
Figure 4. a) A quantitative backscattered electron image where the grayscale intensity value can be related directly to the mean atomic number; locations used for quantitative EDS and Li-CDM analysis are indicated. b) A graphical representation of the lithium content of the six NMC particles analyzed using Cipher.
This is a significant step forward in the analysis of battery materials as, for the first time, the charge state of a cathode material was determined in a conventional SEM. Here the ~25 at.% Li corresponds to the uncharged battery state.
Summary
The lithium by composition by difference method was demonstrated in stoichiometric compound samples. The lithium content of a high-purity lithium aluminate crystal substrate was determined to be 9.5 wt.% within ~ 1 wt.% of the stoichiometric value, an accuracy similar to previous reports for metallic samples [2].
For the first time, the lithium content of an NMC cathode material was determined quantitatively in a conventional scanning electron microscope. A mean lithium content of 22.5 at.% was measured experimentally, corresponding to the uncharged battery state in this material. These results validate Li-CDM for a wider range of materials, opening exciting characterization possibilities in lithiated battery materials using Cipher.
References
- P. Hovington et al., Scanning 38 (2016) p. 571–578
- R. Gauvin and N. Brodusch, Microsc. Microanal. 28 (Suppl 1), 2022. doi:10.1017/S1431927622002847
- J.A. Österreicher et al., Scripta Materialia 194 (2021) 113664
- Austrian Patent Application A 50783/2020
- J. Donovan et al., (2003) Microsc. Microanal. 9, p. 202. DOI: 10.1017/S143192760030137
- A. Garitagoitia Cid et al., Ultramicroscopy 195 (2018) 47
D. Kaczmarek, Scanning Microscopy 12 (1) (1998) p. 161-169