Wavelength dispersive x-ray spectroscopy (WDS) is a remarkable analytical technique that uncovers the elemental composition of a sample by examining the characteristic x-rays it emits. As a powerful companion to energy dispersive x-ray spectroscopy (EDS/EDX), WDS offers enhanced resolution and sensitivity, enabling a precise identification and quantification of elements present in diverse materials.
What is WDS? Advantages Workflow for WDS
What is WDS?
When an electron beam interacts with a sample, it generates x-rays characteristic of the elements present, providing critical information about material composition. EDS and WDS analyze these characteristic x-rays; however, EDS separates x-rays based on energy, while WDS separates x-rays based on wavelength. WDS offers higher resolution and better accuracy than EDS, which is typically faster and more sensitive to lower-energy x-rays.
A WDS system integrated with a scanning electron microscope (SEM) systematically collects and analyzes the emitted x-rays in terms of energy and intensity, enabling precise elemental identification and quantification.
The main components of a WDS analysis system include an electron beam source (from the SEM), x-ray collection optics, a diffractor (crystal), and an x-ray detector. The diffraction crystals disperse x-rays by wavelength according to Bragg’s law, which states that x-rays of a specific wavelength are refracted at a particular angle. The rotation of the diffractor is set to direct specific wavelengths, such as the characteristic x-ray of the element of interest, toward the x-ray detector. This detector measures the intensity (flux) of the selected x-rays.
Visit EDAX.com for more information on WDS products and applications.
Advantages of WDS
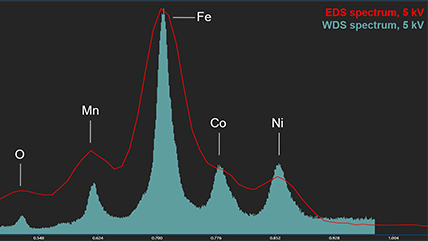
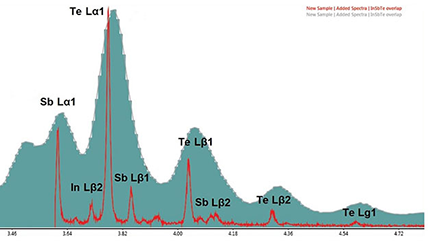
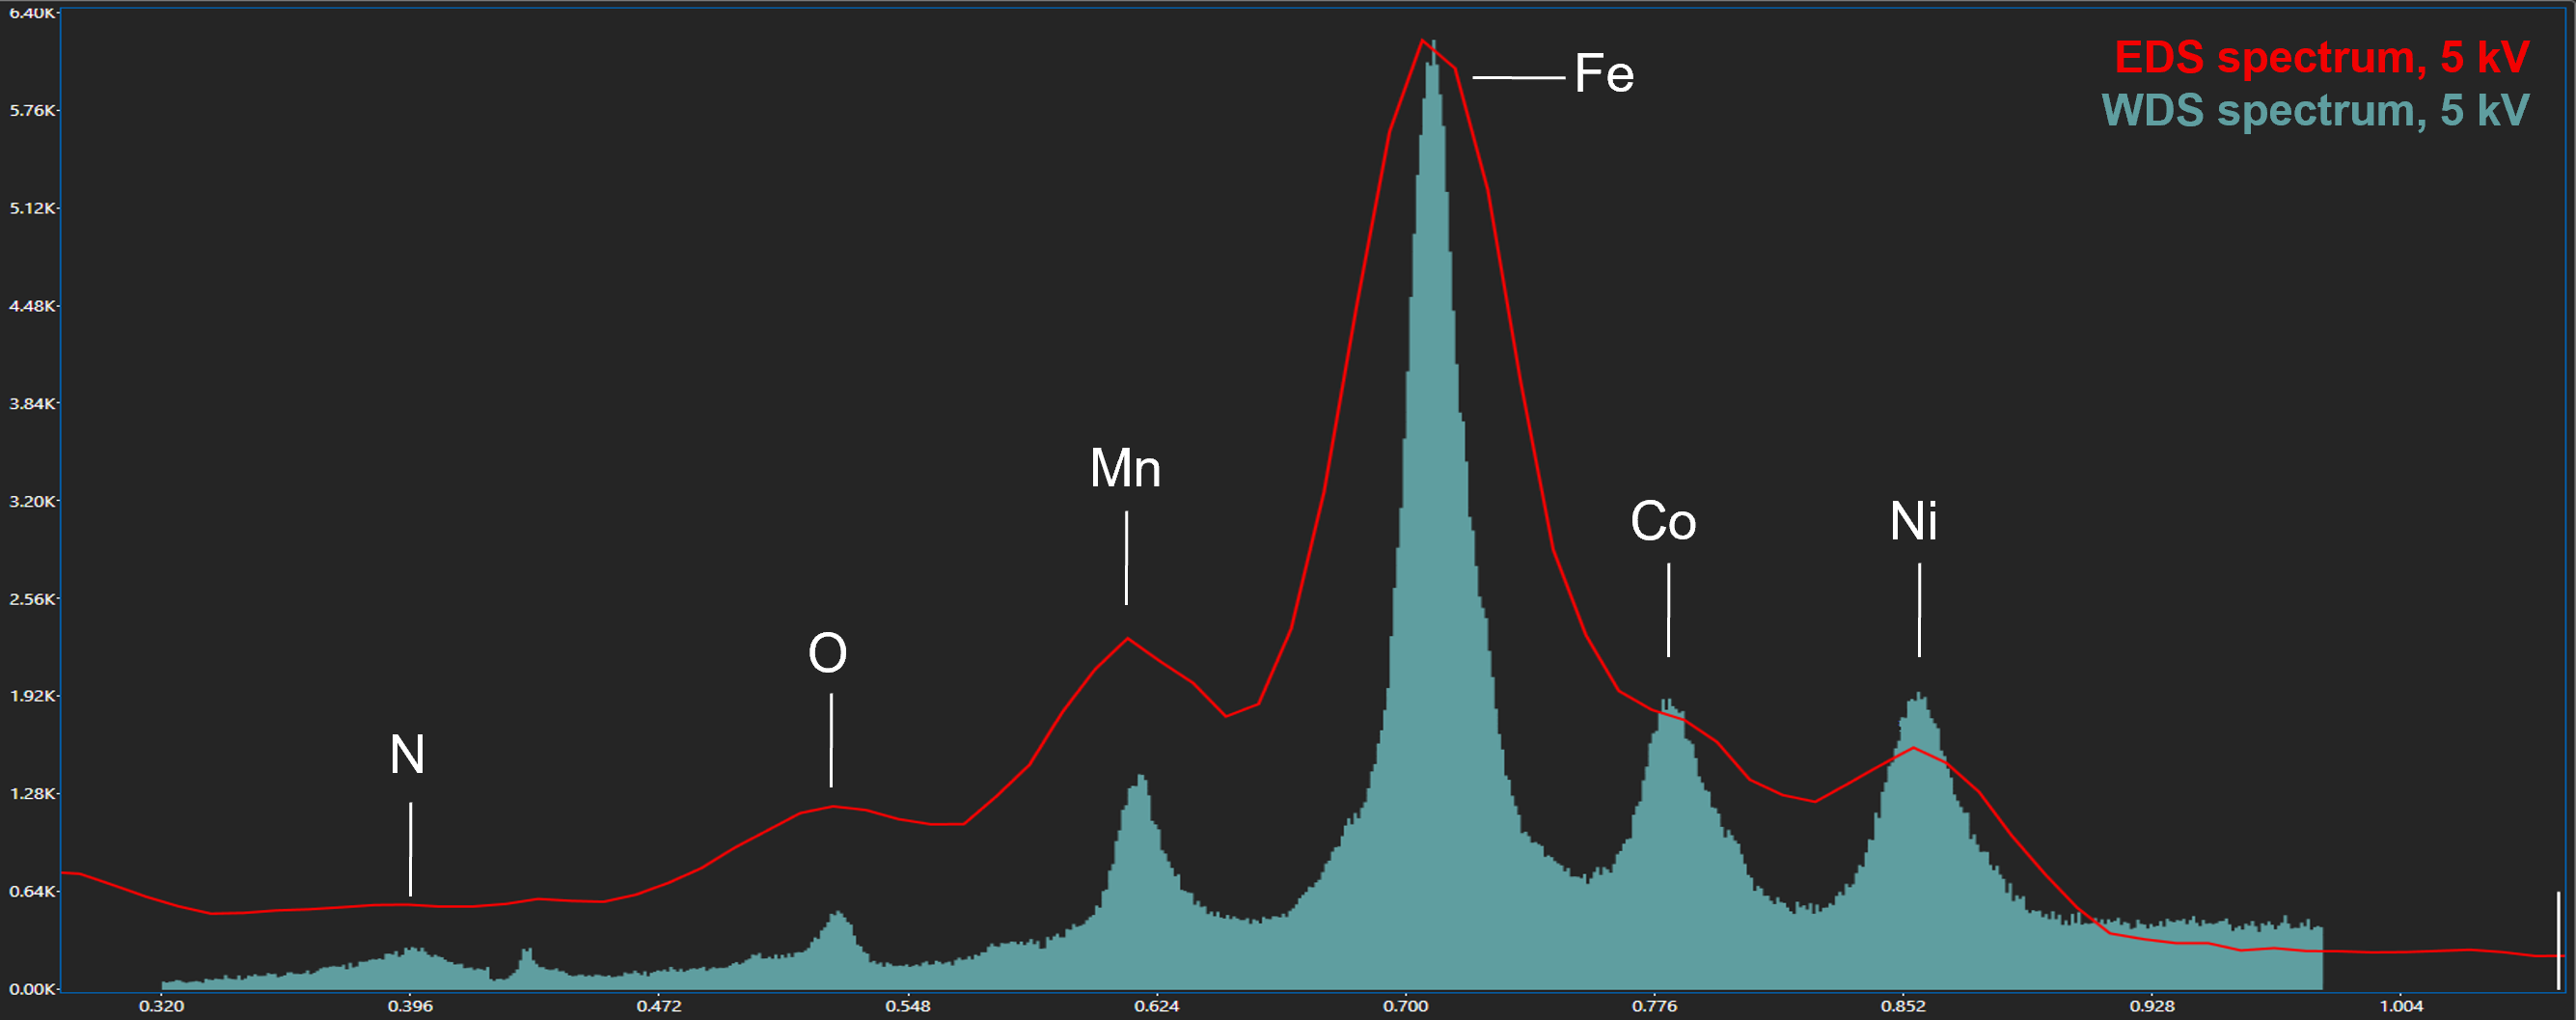
WDS enhances peak resolution and signal-to-noise ratio, making it ideal for materials analysis, especially when dealing with complex samples with overlapping x-ray lines or trace elements. Discover how its capability to detect light elements is a game-changer for a wide range of applications.
| Capability | Advantage |
|---|---|
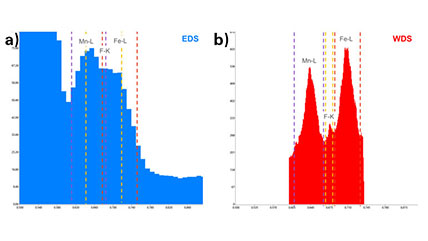
| Identifies elements in complex samples | Offers better spectral resolution than other x-ray analysis techniques (e.g., EDS), making it ideal for analyzing complex samples that have overlapping x-ray lines (see Figure 1) |
| Allows the study of trace elements | Delivers a >10x improvement in the minimum detection limit compared to EDS (~0.01 wt.%), enhancing the detection and quantification of trace elements |
| Examines traditionally problematic light elements | Unique ability to measure low-intensity peaks makes the detection of light elements possible, including beryllium, boron, carbon, nitrogen, and oxygen |
| Accurately quantifies elements | Highly accurate and precise quantitative analysis enables it to distinguish elements more easily, leading to more reliable and impactful results |

Workflow for WDS
|
|
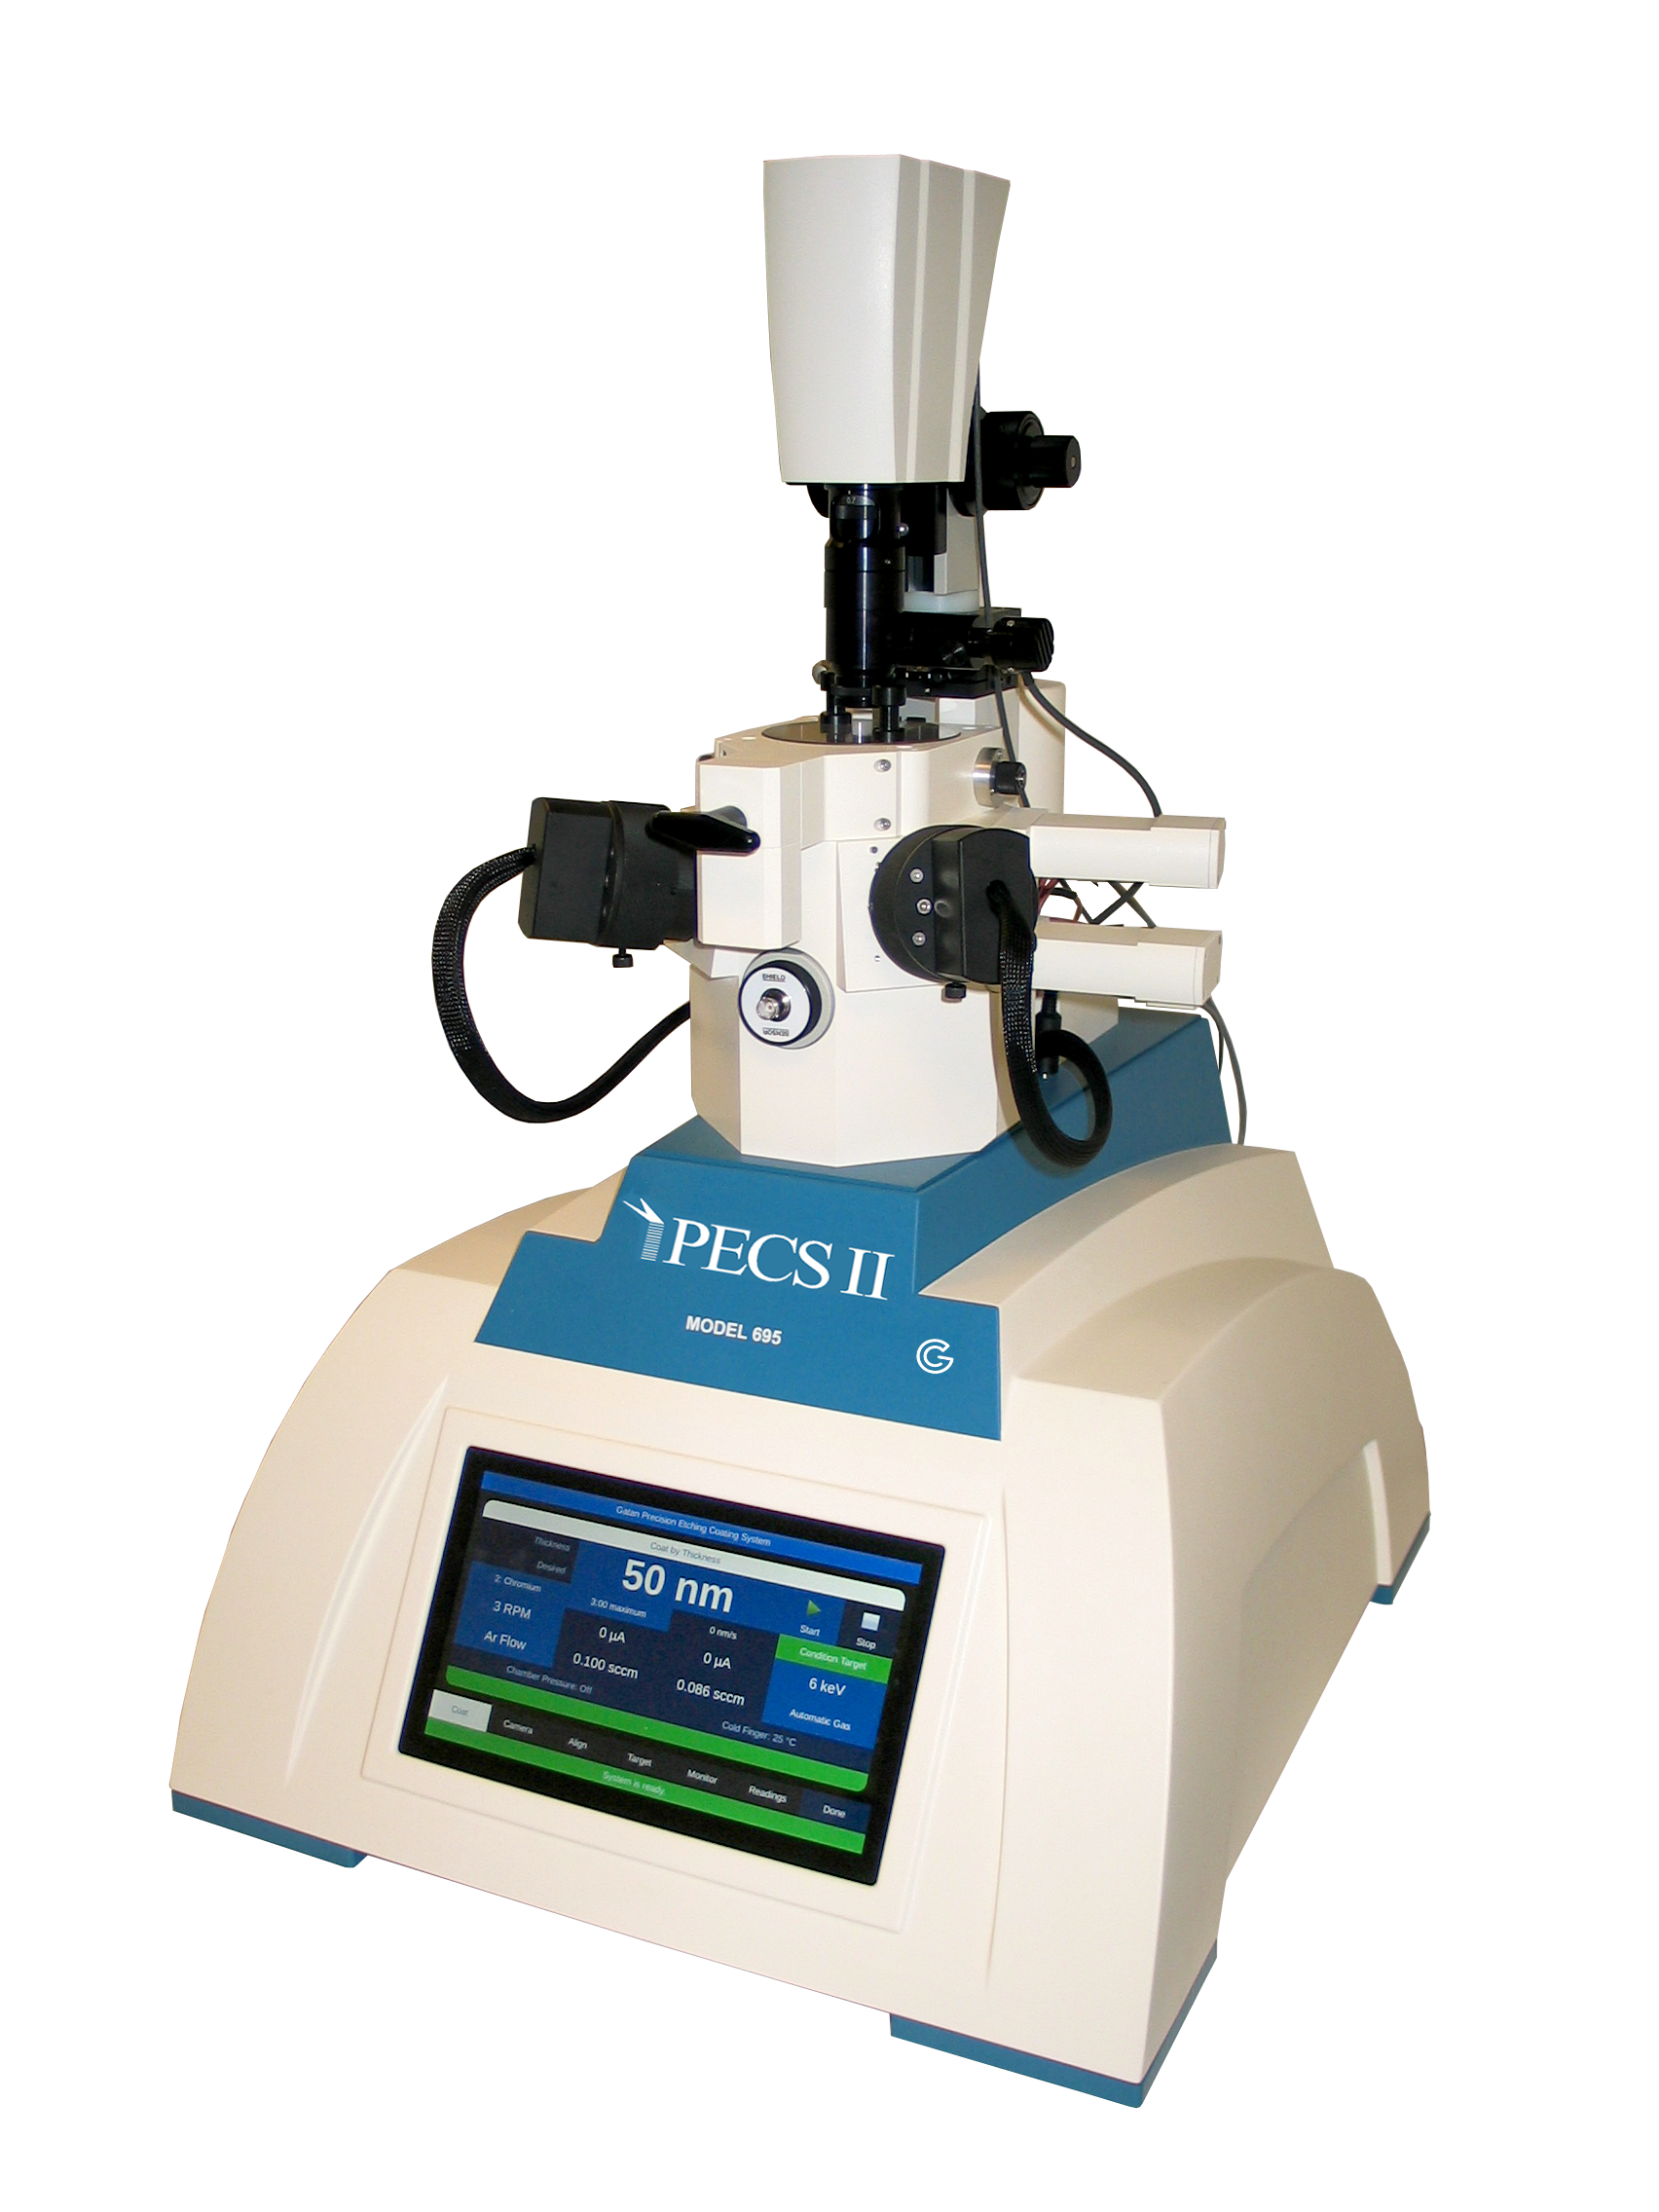
Step 1: Sample preparation Samples must be flat, polished, and mounted on holders or stubs. Non-conductive samples require a coating to eliminate charging effects that could cause image distortion or drift. The best way to accomplish this is to utilize a fully automated argon ion polishing system, like the PECS™ II instrument. A PECS II instrument can produce damage-free surfaces, cross-sections, and deposit coatings to protect or eliminate charging. |
|
|
Step 2: Data collection WDS detectors collect emitted x-rays when the microscope beam hits the sample. These x-rays are collected by the WDS detectors, and various crystals in the detectors are used to separate and diffract specific x-ray wavelengths. This provides precise measurement of the intensity of a single x-ray line at a time. The EDAX APEX™ software makes this conversion possible. WDS can also be combined with related techniques, such as EDS and electron backscatter diffraction (EBSD), to further understand the material’s composition. Visit edax.com for more information on WDS data collection. |
|
|
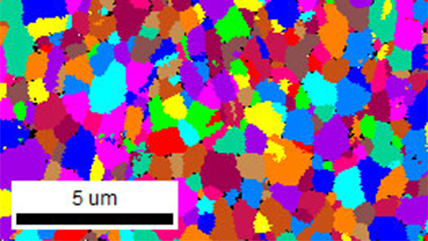
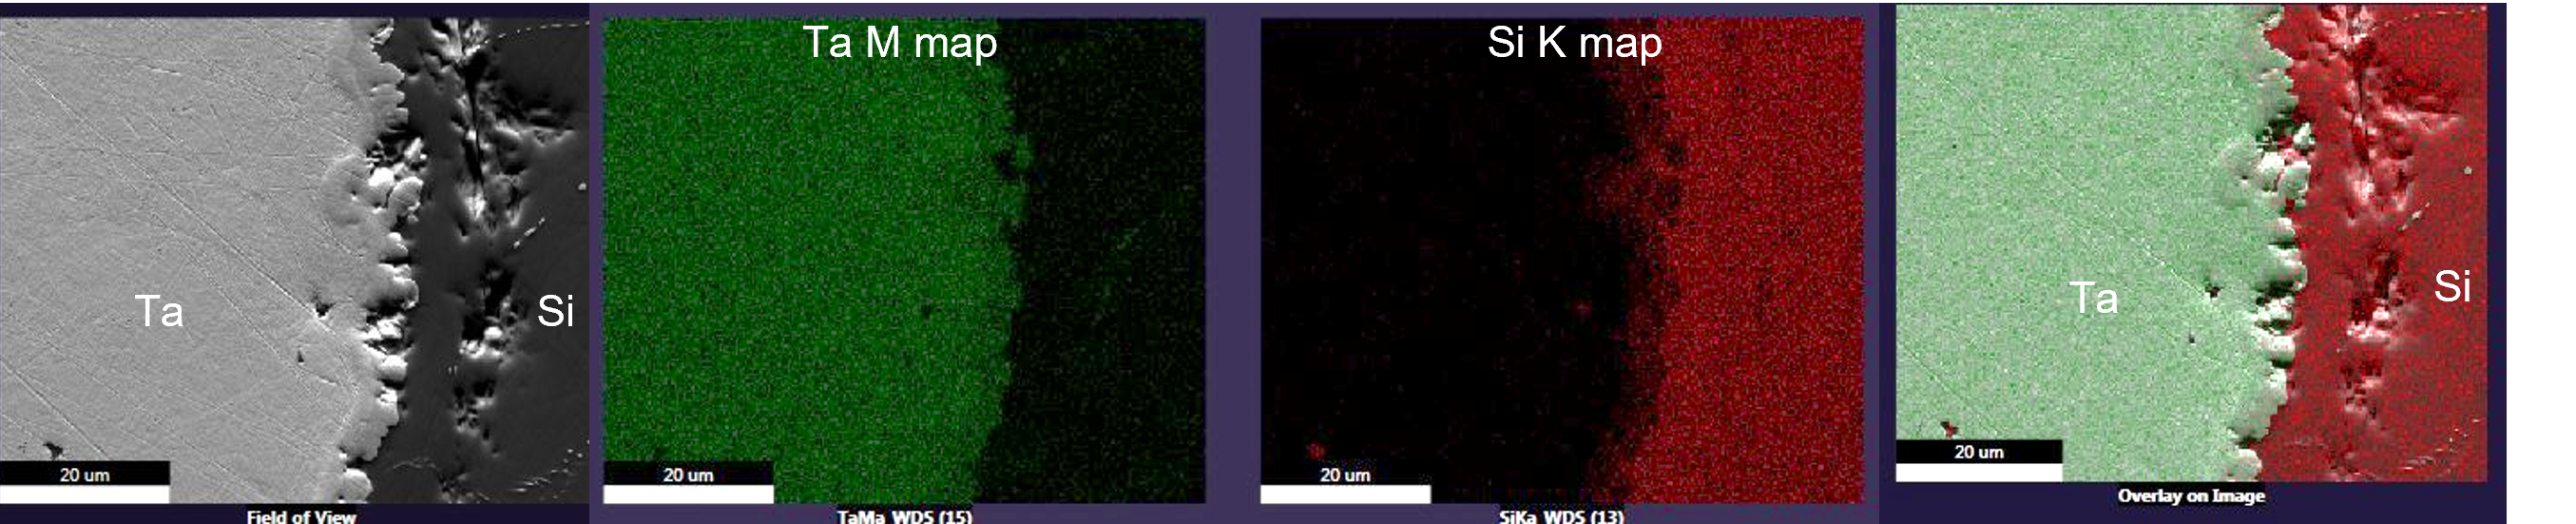
Step 3: Analyze Once the data is collected, APEX software can produce elemental maps, distributions, phase maps, and quantification analyses. The results provided by WDS provide better accuracy and enhance the analysis of complex materials. Visit edax.com for more information on WDS analysis software. |

Combines the EDAX wavelength dispersive spectrometry (WDS) analysis software with state-of-the-art spectrometers for improved accuracy and precision, guaranteeing the best results for your materials analysis.
 System")
By integrating energy dispersive spectroscopy (EDS) and wavelength dispersive spectrometry (WDS) analytical techniques on a single platform, EDAX Neptune provides the power and flexibility of EDS with the resolution, precision, and detection limits of WDS.
 System")
Combines the latest advances in energy dispersive spectroscopy (EDS), electron backscatter diffraction (EBSD), and wavelength dispersive spectrometry (WDS) in a single analytical tool.

Premier software program for collecting and analyzing energy dispersive spectroscopy (EDS) data and the compositional characterization of materials.